Bee decline, pollination and food production
Summary
There are widespread concerns that falling honey bee numbers will lead to food shortages.
This view is not universally accepted and further information is needed to determine future directions to reduce the potential impact of bee decline.
Here I examine yield changes over 51 years for three agriculturally important and predominantly bee pollinated families (Brassica, Cucurbit and Rose families) and I compare them to their cohorts having similar production over 119 crops.
To allow comparisons between different crops relative yield changes (percent) have been used as a surrogate for pollination success over time.
In the two most important crop production cohorts (> 100 Million Tonnes (Mt) production per year and 20-100 Mt), the average yields of the three bee-requiring crop families are increasing faster, on a relative basis, than the cohort average.
In the two smaller cohorts (1-20 Mt and < 1 Mt) the reverse occurs. Also the yields of the annual species in these three crop families are increasing rapidly, whereas those in perennial crops are not. These factors (scale of production and annual v perennial habit) are independent of a requirement for bee pollination.
Reasons for these results and implications for food production are considered. If bee pollination is obligate then reduced bee numbers would be expected to be limiting both current crop yields and yield increases over time. There is no evidence that this has occurred.
Key words
Bee decline; Pollination; Food Production
Glossary
FAO Food and Agricultural Organisation of the United Nations.
Mt Million tonnes.
t/ha tonnes/hectare.
Brassica Brassicaceae (formerly Cruciferae).
Curcurbit Cucurbitaceae.
Rose Rosaceae.
UNEP United Nations Environment Programme.
Double Haploid Technology a method of producing true breeding varieties in a short period of time.
GM Genetic Modification, a technology for introducing novel genes into an organism.
Parthenocarpic, Apomixis and Germ-line biology all refer to different reproductive strategies.
Introduction; the current debate
There is considerable discussion in the scientific literature, news media and on the web about bee decline and its impact on pollination for food production.
The consensus view (1) is that pollinators, particularly honey bees, are declining and this has major implications for food production (1- 4 and many others).
Several reasons have been advanced for bee decline, but there is little agreement as to the prime cause or combination of causes (1- 5; 5 has a good layman’s summary).
Bee decline is reported widely in the media (6-8), leading to claims that “we can’t afford to gamble any longer with our food, countryside and economy” (9).
In these discussions little attempt has been made to consider the actual impact of reduced bee numbers on crop yields and production. In the UNEP document on emerging pollination issues (1), 58 references are quoted, but only one has production in the title – for seed of two legumes in prairie grasslands.
Ghazoul (10) in 2005 suggested that current bee decline levels were less threatening to food production than was apparent in the literature.
His views were immediately challenged (11). Although Ghazoul (12) replied, his suggestion has basically been ignored by the “bee world”.
Exceptions include Alzen et al. (13) and Cunningham (14) who examined the FAO database (15) for crop yields up to 2006 and found little evidence that yields are falling due to a lack of pollinators in either developed or developing countries.
Methods and Materials
Data source. I have also used the FAO database (15) over the 51-year period 1961 to 2011 for production and yields of 119 food crops, as well as the data for individual countries.
FAO also provides data on honey production (16).
Analysis used. The 119 crops were split into cohorts based on their total production in 2011 (Table 1).
These were: Massive Crops (13 crops, > 100 Million Tonnes [Mt] produced in 2011), Major Crops (31 crops, 20-100 Mt), Minor Crops (45 crops, 1-20 Mt) and Miniscule Crops (30 crops, > 1 Mt).
Note this list of 119 crops does not include either industrial crops e.g. Tobacco, or unspecified groups, e.g. Fruit, tropical fresh, that are included in the FAO database (15).
My focus is on relative yield improvement of crop members of the Brassica (e.g. cabbage), Cucurbit (e.g. melon) and Rose (e.g. almond) families that are in the FAO database.
These families and crop species (20 species in total) are identified in Table 1 by different coloured crop entries.
Many members of these crop families are widely recognised as having a high requirement for bee pollination for high yields (3, 4).
Yield changes over 51 years for these crop families are compared to the average of all crops in the same production cohort (Table 2).
Absolute yield changes between crops cannot be compared, as a tonne of watermelons is not the same as a tonne of rice; however relative changes in yield over time (% change) are comparable and can be considered as a surrogate for pollination effectiveness (13).
I then consider the corresponding data for France and the USA, two countries where major bee losses are reported.
Also many species of these three crop families are widely grown in both France and the USA.
It would be expected that bee decline would show its impact primarily on the yield of these widely grown bee-sensitive crop families (3,13,18,19), but have little effect on the cohort averages that include many other species that are either self- or wind-pollinated.
Results for world crop data
Average yield changes over time between the five year periods 1961-65 and 2007-11 for the three high bee-requiring families used here are compared to the average yield change of their production cohort in Fig. 1.
Average yields of five years were used to smooth out individual year effects.
The individual yield changes over time of each of the 20 members of the three bee- requiring families together with the cohort means are listed in Table 2.
Fig. 1 and Table 2 show that, as the production importance of a crop decreases, there is a consistent fall in the average yield improvement over time, but there is no corresponding relationship for total crop production (Table 2).
The ten bee-requiring crops in the Massive and Major production cohorts all had positive yield increases over the 51 years (Table 2).
In the Massive group yield improvement for watermelons, the only bee requiring crop in this cohort, was 192%, whilst the cohort mean was 102% (Fig. 1).
Besides exceeding the mean, the percentage yield increase of watermelons was the largest in the cohort.
A similar result occurred in the major crops where the average yield increase of the cohort was 80%, but the bee-requiring crops averaged 104% (Fig. 1).
For Cucumbers, pumpkins and rapeseed yields increased by over 200% (Table 2).
These were the only species of the 31 in this cohort to have such large increases.
In the Minor and Miniscule crops some yield changes for over time for the three bee-requiring families were positive, whilst for others yields decreased.
For the Minor cohort the average yield increase was 47%, but in the bee-requiring group it was only 19% (Fig. 1 and Table 2); Cherry, Plum and Sour Cherry yields decreased (Table 2).
In the Miniscule cohort average yield increased by 39%, but for the bee-requiring group it was a mere 13% (Fig. 1).
The yields of the annual bee-requiring crops increased (mustard and melon seed); whereas for the perennial species (quince and raspberry) they decreased (Table 2).
In the Massive and Major cohorts yield increases over the last 51 years were large, but the average increase was even greater for the ten species of the three bee-requiring families.
For the Minor and Miniscule crops, the reverse occurred.
The bee-requiring crops had low or negative yield changes over time and their average was less than that of their cohorts.
Table 2 also shows that there are large differences between perennial and annual crops.
For the ten perennial crops (marked ‘+’ in Table 2) average yield increase over 51 years was an insignificant 3%, ranging from +78% for almonds to -64% for plums.
In the ten annual crops (including the crops grown as annuals: Cabbages, Cauliflowers and Strawberries), the average yield increase was 122%, ranging from 222% for pumpkins to 25% for cauliflower. The yields of these ten annual bee-requiring crops increased faster than the average yield increase of the 13 species in the massive cohort. Interactions occurred between cohorts. There were no negative yield changes for the ten bee-requiring crops in the Massive and Major crop cohorts whereas in the ten Minor and Miniscule crops they were positive for annual, but were negative for some, but not all, of the perennial crops (Table 2).
World crop data discussion
Why is the size of the crop important?
Scale matters because large crops attract more funding, both public and private, for research, development and extension.
This phenomenon has long been recognised: “For he that hath,to him shall be given: and he that hath not, from him shall be taken even that which he hath”(17).
Clearly the relative rates of change in crop yields over time and crop importance are related. This greater resource allocation to large crops has produced a high rate of yield improvement whilst for small crops the reverse is true.
Why are annual crop species at such an advantage?
Annuals are “easy” to breed: in one year useful data from several sites can be obtained.
In some annual crops breeding can be accelerated by growing several generations/year and/or by using double haploid technology. Rapid seed multiplication means farmers get new varieties quickly and cheaply.
Also any new technologies for growing crops can be rapidly introduced into farmers’ fields, sometimes within a year.
The extra cash flow generated from innovation is immediately available to farmers.
None of these advantages occur in perennial crops. It is often several years before trees flower and even more before their yield and quality can be determined in a range of environments.
Once orchards are established, it is often difficult to implement improved management techniques because of the initial planting arrangement.
Increased cash flows from growing improved varieties or implementing improved technologies in perennial crops are often many years away from an initial, large investment.
Thus testing and then adopting new technology is riskier for farmers growing perennial than for those growing annual crops.
Neither of the factors ‘scale of production’ or ‘perennial versus annual habit’, is bee-dependent and it is highly unlikely that, on a world scale, bees are limiting production of the 20 bee-dependent crops examined here.
The world honey data supports this, as production has increased nearly three- fold in the last 51 years (16).
If bee decline was affecting world yields, then on average, yield increases over time would be expected to be less for the three bee-requiring crop families examined here than for the other crops in their cohort.
Also, on average, yields of bee-dependent crops would be expected to be affected equally in all crop cohorts or even more so in the massive and major cohorts as more bees are required to pollinate the much larger areas of these crops (3).
Similar expectations apply to the differences between perennial and annual crops. If bee pollination is limiting yield, then on average, it should apply equally to both large and small crops and to annual and perennial ones. Clearly it does not.
Results for two countries reporting bee decline
Country crop data for France and the USA
Both France and the USA are countries where there is considerable concern about bee decline and where several Brassica, Cucurbit and Rose crops are grown (4,15,18 & 19).
This combination provides the opportunity to examine, on a more local scale, the importance of bee decline on crop yields, using country data from the FAO database (15).
The Brassica, Cucurbit and Rose family yield data for France are in Figures 2-6.
The corresponding data for USA are in Figs 7-11. Note y axis scales vary and that for Rapeseed, the USA data is only available from 1986, and therefore has not been included in the Figures, whereas it has for France (Fig. 2).
Figs 2-6 provide little indication of recent, systematic reductions of crop yields in France for bee-sensitive crops over time.
The yields of Brassica grain crops (Mustard seed and Rapeseed) improved over time (Fig. 2).
In the case of cabbages and cauliflowers (Fig. 3), seed is only needed to plant crops as the parts eaten are harvested pre-flowering.
It is hard to imagine situations where seed producers are unable to manage pollination requirements for seed production even if costs are increased.
Note that seed production values for these two crops are commercially significant for seed companies and details are not available to the public. Variations in the yields of vegetable Brassicas crop yields are bee-independent.
These comments also apply to Fig. 8 for the USA data.
In Cucurbit crops (Fig. 4) yields rose for many years, but there has been a dramatic, recent drop in cuccumber yields and a fall in yield of both pumpkins and watermelons between 2009-11.
In the Rose crops (Figs 5 & 6) the yields of Apricots, Cherries and Raspberries show little change over time, whereas the yields of all the other species have increased for the last 30 years.
The picture is even more clearcut in the USA (Figs 7,8,9 &10).
All crops have shown an increase in yield over the time, some very large indeed (both types of melon, (Fig. 8); apples, (Fig. 9); pears and strawberries, (Fig. 10). The only Brassica seed crop reported for the USA is rapeseed.
The data is for the period 1986-2011 and is not shown here as it is an inadequate times series, but shows an upward trend (15).
Discussion of the data for France and the USA
For the French bee-sensitive crops of the three families considered here, yields have either been stable or have increased over time (Figs 2, 3, 5 & 6).
The exception is in the cucurbit crops (Fig. 4) where yields increased rapidly up to and including 2007 and then for cucumbers the yields fell dramatically.
There was a similar, but smaller, decrease for pumpkins and watermelons, but the yield of other melons increased slowly over the period (Fig. 4).
When the three years (2005-2007) are compared with the following three years (2008-2010) for production, area and yield of French cucumbers, there was only a minor change in total production (16% higher in the latter period) whereas there was a dramatic increase in area (271%) and a 57% fall in yield (15).
Possible reasons for this are government policy and/or changed economic circumstances making high cost intensive production less profitable than less intensive systems.
It is unlikely to be due to bee decline as the results are not reflected in the other melons nor in the other bee-requiring families examined here and grown in France.
Also on a world scale, cucurbit yields have increased dramatically over the last 30 years (Table 2 & 15).
During this period honey production in France has been more or less constant at about 15,000t/annum (16). Despite a major web search I have been unable to find an explanation for this result.
The USA data show no impact of a lack of pollinators on production (Figs 7-10) in the three bee-requiring families examined here, with many crops showing large increases in yield over the 51 years even though, at the same time, USA honey production has halved (16).
The slight down-turn in almond yields (a crop of great concern for growers and bee keepers (4,19 & Fig. 9) reported for 2011 did not occur, as more recent data [USDA survey of Californian grower yields, (20) for 1995-2012], shows a continuing upward trend, with 2011being the highest yielding year recorded (Fig. 11).
The year to year variation in yields shows no consistent change associated with bee decline – it is most likely due to seasonal conditions.
General Discussion
What are the options for managing a potential but as yet unrealised impact of bee decline on food supply?
There are four broad options: bee-centric, crop-centric, farmer-centric and GM-centric.
Bee-centric
Reasons for bee decline are not yet clearly identified and many possibilities have been suggested (1, 4). Ways to avoid, manage, reduce or cure the factors involved in bee decline and their interactions need to be understood.
This is an area where bee science and other skills are currently focused. Bee management needs to progress from semi-domestication to full domestication so that, as with other farm animals, nutrition, health, management, genetics, breeding and production regimes are understood and optimised at a local scale.
This should include “clean bee colony production systems” similar to those for broiler chickens where populations “crash” every few months and standard production practices ensure that chickens are completely, quickly, healthily and cheaply replaced.
The development of such systems for bees would mean that bees would always be available for distribution to bee keepers and crop growers as and when needed.
This may require attitudinal changes by both amateur and commercial bee keepers, scientists and crop growers to develop effective and consistent, managed colony replacements.
Crop-Centric
In 1922 Vavilov (21) proposed the law of homologous variation.
This states that if a characteristic exists in one species, it is highly likely to exist in related species.
Within the Brassica family there is much confusion about the level of cross- and self-pollination required in rapeseed (Table 3).
This may be due to confusion between pollination studies involving Brassica napus and B. rapa both being reported as rapeseed to explain reported bee pollination requirements that vary from 0 to 100%! (Table 3).
Rapeseed breeders, when growing plants of B. napus in isolation cages to maintain pure lines, report considerable variation between varieties in their ability to self- pollinate.
Should bees disappear, there will be immediate elimination of high bee-requiring rapeseed varieties in both farmers’ fields and breeding programmes, as they will be low-yielding.
High-yielding replacement varieties of B. napus with low or zero bee pollination requirements already exist and are widely grown. If sought, this self-pollination capability is likely to be found in all Brassica crops (21).
In the cucurbit family male and female flowers are on separate parts of the same plant but plants are self-compatible.
The issue is whether fully self-fertile varieties with hermaphrodite flowers can be bred that are high-yielding and meet market requirements.
Hermaphrodite flowers, controlled by a recessive gene, occur in both water- and other melons (22, 23).
If selected for, this characteristic will improve rapidly and is likely to be available in all cucurbit crop species (21). Selection for self-fertility is simple, and like rapeseed requires exclusions cages to keep bees and other pollinators out.
As the plants are annuals, if no bees are available, fully fertile, hermaphrodite varieties will rapidly replace bee-requiring ones.
Parthenocarpic fruiting (not needing pollination to set fruit) occurs in cucumbers (23). Self-compatible types are available for all the rose family tree crops examined here (Table 4).
They are used by people wishing to grow a single fruit tree in city gardens. Their value, for the reasons outlined earlier, to commercial growers is less certain.
Their ability to self fertilise is variable, but would be rapidly improved by selection.
As a fall back position, pre-breeding by public organisations to identify varieties of all three families that are fully self-fertile and near commercial for both yield and quality would pay long term dividends if the more pessimistic predictions for bee populations are realised.
This approach contrasts with that of Free (24) who also recommends a crop-breeding approach, but to make flowers more bee-attractive, rather than bee-independent, as proposed here.
For reasons outlined earlier, breeding self-pollinating and self-fertile perennia crops will be slower and more expensive than for annual crops and would require a long term commitment of people, facilities and funding to be successful.
In dieoecious crops where male and female flowers are on different plants (e.g. pistachio, kiwi-fruit) , this approach will be significantly more difficult to realise.
Ultimately the path forward is a “simple” balance between product demand and the prices and costs of alternative strategies for pollination management. The genetics are not in doubt.
Farmer-centric
Farmers are very acute observers. For thousands of years they have made all the major advances in crop growing; species domestication, variety selection, irrigation, rotation, nutrition, pest control and adaptation to new locations.
Farmers are many and crop scientists – particularly of minor crops – few. If made aware of the bee decline situation and its potential impact on their livelihoods, they would look for ways to improve their production.
In these circumstances the chances of finding self-pollinating varieties, particularly in minor and miniscule crops, would increase significantly.
GM-centric
The production of complex biological molecules using microorganisms and GM are well established (insulin, rennet and vaccines).
Vanillin, the flavour of vanilla, is already made artificially without using a GM approach.
In the worst-case scenario it would be possible to produce many plant flavours using GM technology.
These products would be purer than those occurring in nature, but would lack local subtlety.
Alternative GM approaches might include developing plants with apomixis or parthenocarpic fruits using germ-line biology to find genes that allow seed or fruit growth without pollination (25).
However the non-GM options outlined above are likely to be both cheaper and less controversial.
Conclusions
The suggestion (10, 12, 13 and 14) from nearly a decade ago that the “bee lobby” has over-stated the effect of bee decline on food production is correct.
The focus has been on bees whilst yield, the other side of pollination equation, has largely been ignored.
The data show that scale of production and annual v perennial habit have been the key drivers of yield increases or decreases in 20 crops from three bee-dependent plant families over the last 51years.
These two factors are bee-independent and the rate of yield improvement in the annual species of the bee-requiring families examined here have been faster than their comparable crop cohort.
A lack of bees would be expected to affect yields of large crops more than small ones, whilst, in fact, the opposite was observed.
Even in the worst-case scenario of near total, worldwide honey bee colony collapse, there are several alternative approaches to ensure these foods remain on the menu.
The impact of bee-pollinator loss on biodiversity in wild plants and on honey production is likely to be far more severe than on agriculture.
References
1. Kluser, S., Neumann, P., Chauzat, M-P., Jeffery S. Pettis. J.S. Global. Honey Bee Colony Disorder and Other Threats to Insect Pollinators. UNEP Emerging Issues: 1-16 (2010). @ http://www.unep.org/dewa /Portals/67/pdf/Global_Bee_Colony _Disorder_and_Threats_insect_pollinators.pdf checked active 6.3.2014
2. Anon. Protecting the pollinators. FAO Spotlight: (Dec. 2005). @ http://www.fao.org/ag/magazine/0512sp1.htm checked active 6.3.2014
3. Rural Industries Research and Development Corporation. Pollination Aware – The Real Value of Pollination in Australia. Publication No. 10/081. (2010). @ http://www.naturalbeekeeping.com.au/Pollination%20Aware.pdf checked active 6.3.2014
4. Benjamin, A., McCallum, B. A world without bees. Guardian Books, (purchase on line @ http://www.Guardianbooks.co.UK) 2008 checked active 6.3.14
5. Anon. Bees: decline in numbers. Royal Horticultural Society. @http://apps.rhs.org.uk/advice search/Profile. aspx?pid=528 checked active on 6.3.2014
6. Raskin-Zrihen, R. Solano, Napa honey producers concerned about bee declines. Times-Herald (12.7 2013) @ http://www.timesheraldonline.com/ci_23702532/honeybee-population-decline-is-cause-concern checked active 6.3.2014
7. Beament, E. Urgent review launched into bee population decline. The Independent (28.06.2013) @ http://www.independent.co.uk/environment/nature/urgent-review-launched-into-bee-population-decline-8678624.html checked active 6.3.2014
8. Anon. Bee decline: Government announces 'urgent' review. BBC (28.06.2013) @http://www.bbc.co.uk/news/uk-23090339 checked active 6.3.2014
9. Friends of the Earth, Executive Director Andy Atkins at a meeting organised by Friends ofthe Earth on bee decline 24.6.13 in London, and widely reported in the media e.g. 6 and 7 above
10. Ghazoul, J. Buzziness as usual? Questioning the global pollination crisis. Trends Ecol. Evol. 20, 367-373 (2005a)
11. Steffan-Dewenter, I. Potts, S.G. and Packer, L. Pollination diversity and crop pollination services are at risk. Trends Ecol. Evol. 20, 651-652 (2005)
12. Ghazoul, J. Response to Steffan-Dewenter el at.: Questioning the global pollination crisis.Trends Ecol. Evol. 20, 652-652 (2005b)
13. Alzen, M.A., Garibaldi,L.A., Cunningham, S.A., and Klein, A.M. Long term global trends in crop yields and production reveal no current pollination shortage but increasing pollinator dependency. Current Biology 18, 1572-1575 (October 28 2008).
14. Cunningham, S.A. Honeybee decline warrants concern, but not panic. @ http://theconversation.com/search?q=Cunningham+Bees checked active 6.3.2014
15. FAO crop database @ http://faostat.fao.org/site/567/DesktopDefault.aspx?PageID=567#ancor checked active 6.3.2014
16. FAO honey Database @ http://faostat.fao.org/site/569/default.aspx#ancor checked active 6.3.2014
17. King James Bible, Mark 4:25, but also see Matthew 13:12 and Luke 19:26
18. Anon. Pesticides Not Yet Proven Guilty of Causing Honeybee Declines, Experts Say. Science news. (20.09.2012) @ http://www.sciencedaily.com/releases/2012/09/120920141143.htm checked active 6.3.2014
19.Anon.Honey Bees and Colony Collapse Disorder USDA/ARS News. @ http://www.ars.usda.gov/news/docs.htm?docid=15572 checked active 6.3.2014
20. Annon. California Almond Forecast. USDA National Agricultural Statistics Service @ http://www.nass.usda.gov/Statistics_by_State/California/Publications/Fruits_and_Nuts/201305almpd.pdf checked active 2.5.2013
21. Vavilov N.I. The law of homologous series in variation. J. Genetics. 12 (1) 47-89 (1922).
22. Purseglove, J.W. Tropical crops: Dicotyledons1, p112. Longman, Green and Co. Ltd London (1968)
23. Woodcock (2012) Pollination in the Agricultural Landscape @ http://www.pollinator.ca/canpolin/images/Pollination%20in%20Agricultural%20Landscape_Woodcock_Final.pdf checked active 6.3.2014
24. Free J.B. Insect pollination of crops. Second edition 1993. Academic Press Ltd. London
25. Hand L.M and Koltunow A.M.G. 2014 The Genetic Control of Apomixis: Asexual Seed Formation Genetics, June 2014 197:441-450; doi:10.1534/genetics.114.163105
Acknowledgements
I would like to thank Freda Blakeway, Michael Chisholm, Dianne Davidson, William Erskine, James Ridsdill-Smith, Alistar Robertson, and Neil Turner for instructive comments on various drafts of this paper.
The referee’s comments helped improve the focus and clarity of the paper.
Download pdfFigures
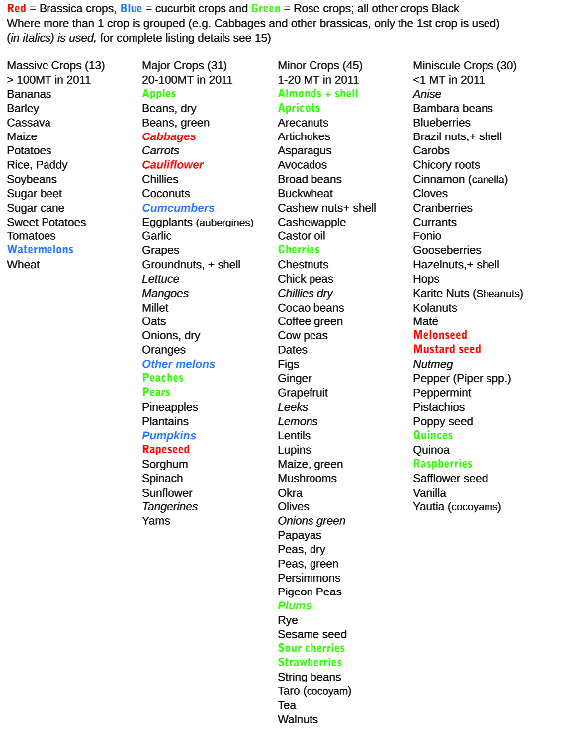
Table 1: Crops from the FAO database (15) used in this study; arranged alphabetically and by 2011 production cohort (Mt). The three crop families examined here in detail are in different colours to allow their easy identification within cohorts.
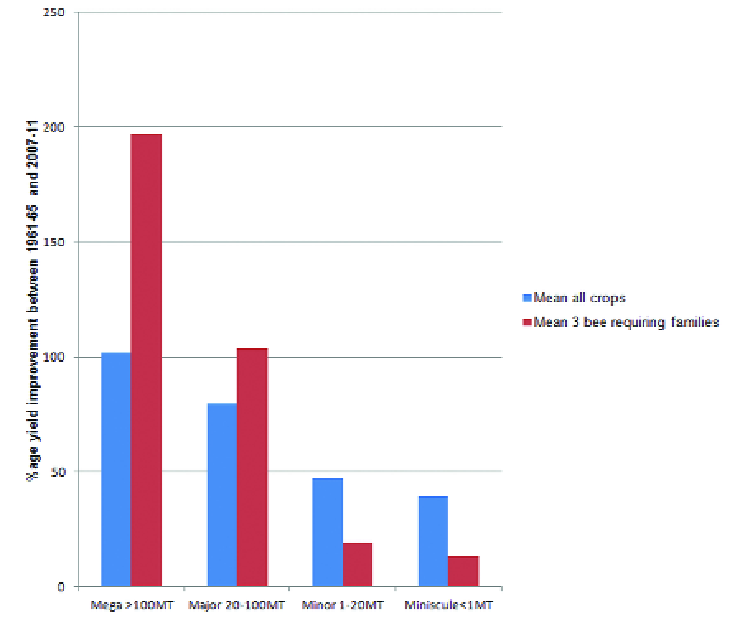
Fig 1. Percentage mean yield change between 1961-65 and 2007-2011 for the four production cohorts (>100Mt, 20-100Mt, 1-20Mt and <1Mt in blue) and the corresponding percentage mean yield change for the 3 bee requiring families in each cohort (in red)
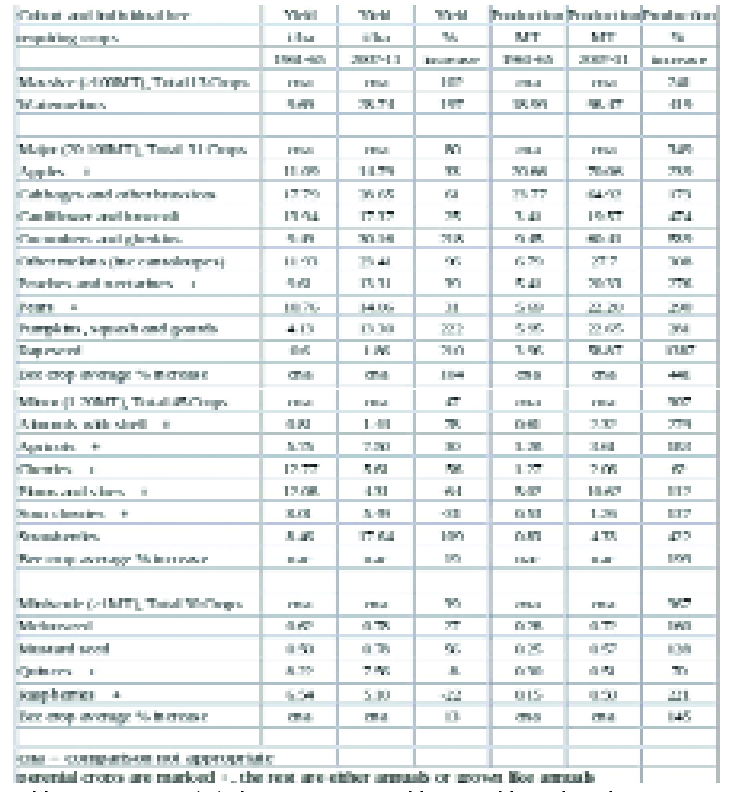
Table 2: Percentage (%) change in mean world crop yields and production per cohort (Massive, Major, Minor & Miniscule) and the actual yields (t/ha) and production (Mt) and their percentage improvement for the 20 crops of the Brassica, Cucurbit and Rose families examined here for the 5 year periods 1961-64 and 2007-2011.
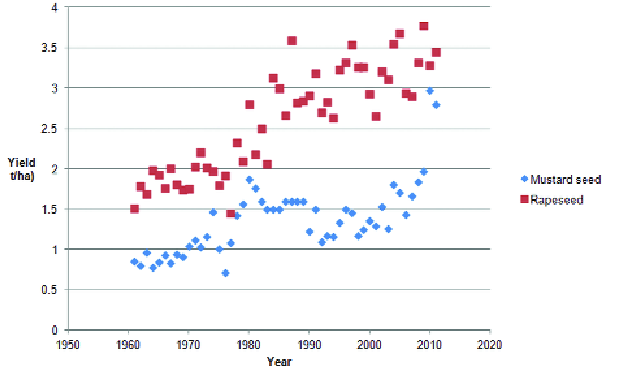
Fig. 2 France, seed Brassica crop (mustard seed and rapeseed) yields (t/ha) for the 51 years 1961-2011
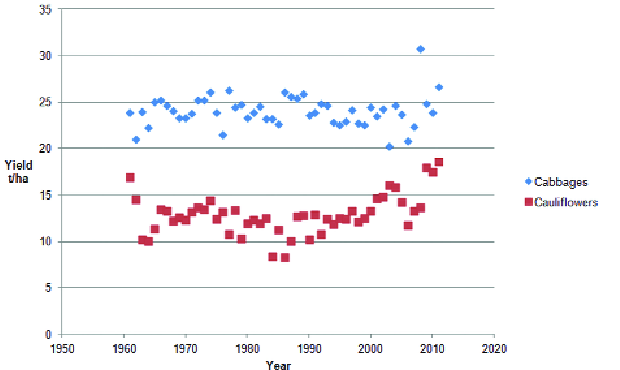
Fig 3. France, vegetable Brassica crop (cabbages and cauliflower) yields (t/ha) for the 51 years 1961-2011
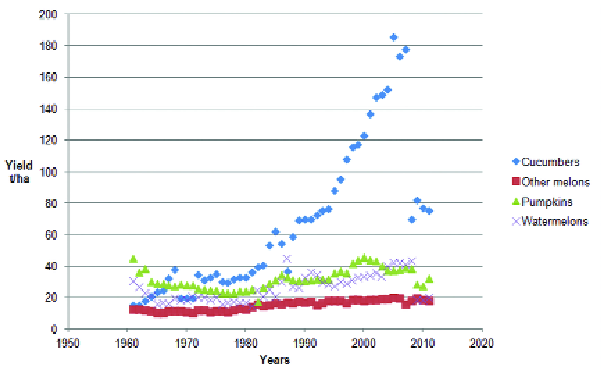
Fig 4. France, Cucurbit crop yields (cucumbers, melons and pumpkins) for the 51 years 1961-2011
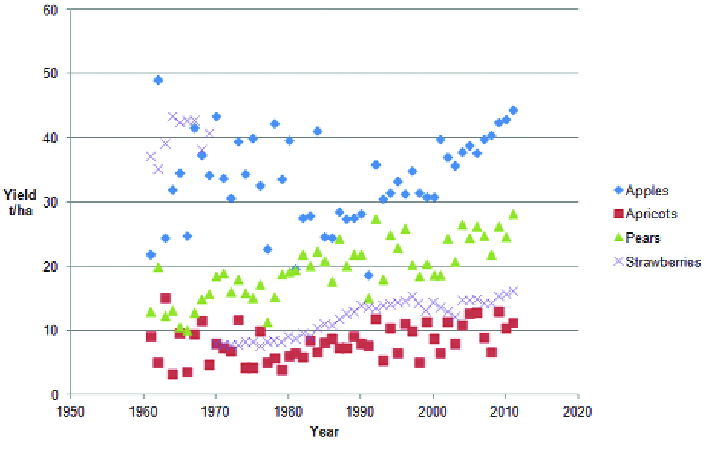
Fig 5. France, Rose crop yields (apples, apricots, pears and strawberries) for the 51 years 1961-2011
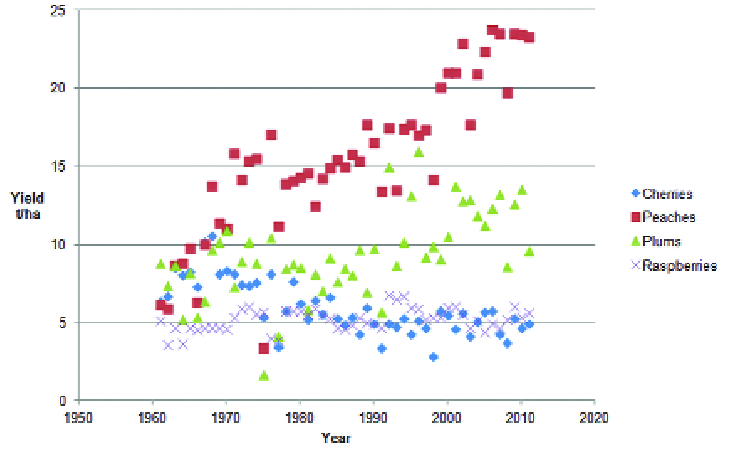
Fig 6. France, Rose crop yields (cherries, peaches, plums and raspberries) for the 51 years 1961-2011
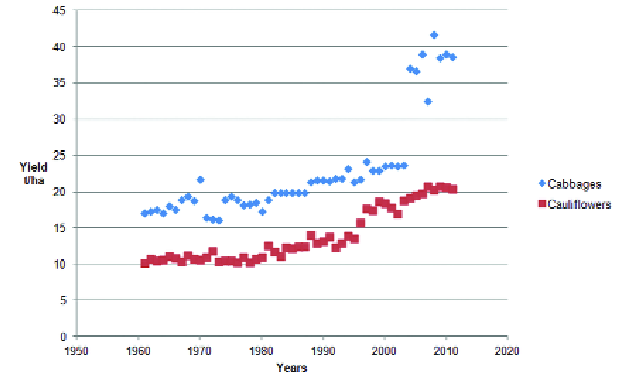
Fig 7. USA, vegetable Brassica crop yields (cabbages and cauliflower) for the 51 years 1961-2011
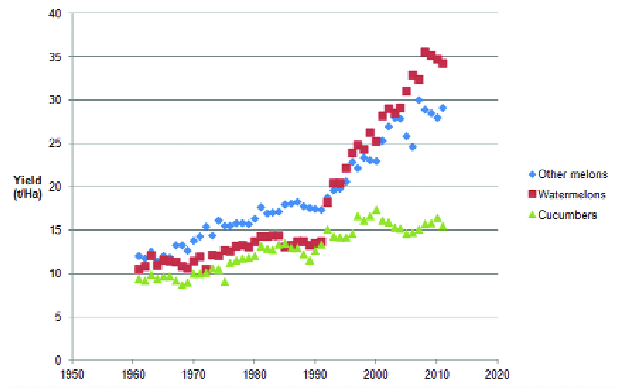
Fig 8. USA, Cucurbit crop yields (cucumbers, melons and water melons) for the 51 years 1961-2011
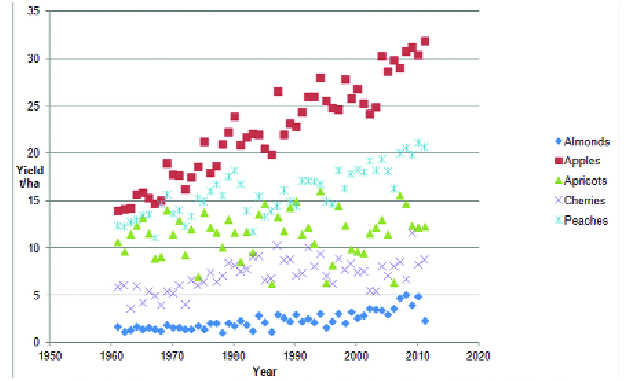
Fig 9. USA, Rose crop yields (almonds in shell [c.f. Fig. 11 the yield is shelled almonds], apples, apricots, cherries and peaches) for the 51 years 1961-2011
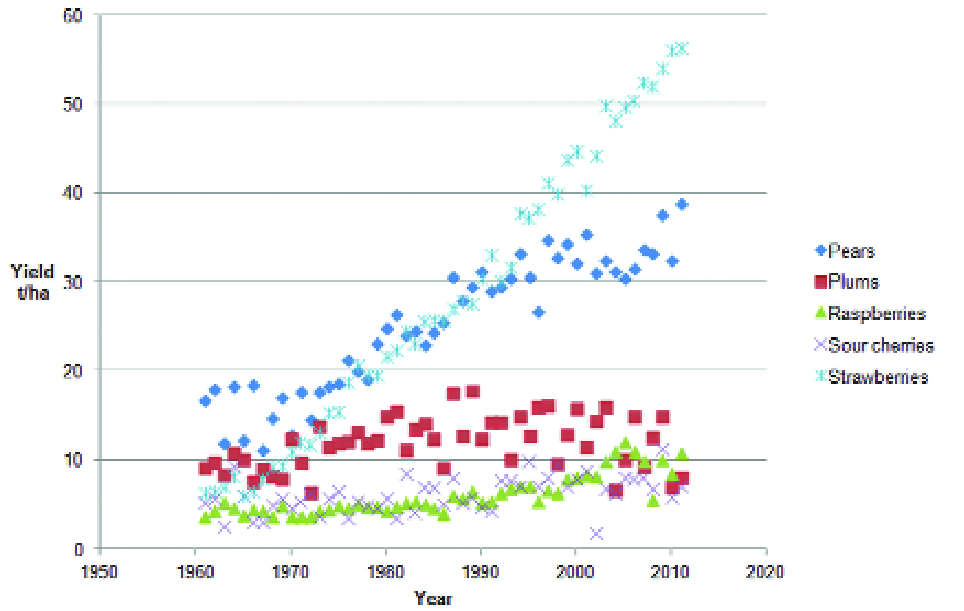
Fig 10. USA, Rose crop yields (pears, plums, raspberries, sour cherries and strawberries) for the 51 years 1961-2011
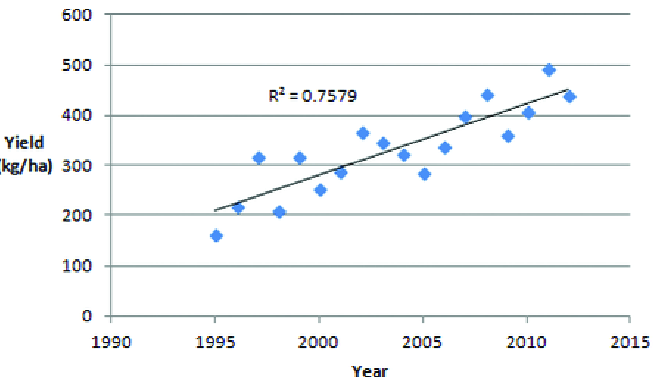
Fig 11. USA, almond yield (without shells, c.f. Fig. 9) 1995-2012 ex USDA (20)
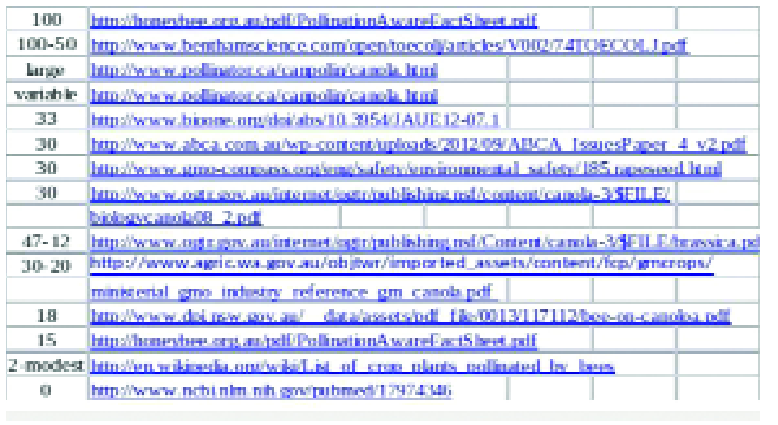
Table 3: Web sites quoting different estimates for insect dependency for pollination of rapeseed. (all sites active 10.3.2014)
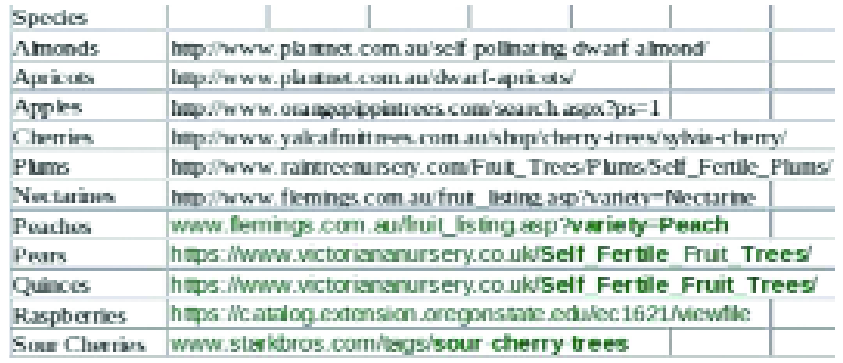
Table 4: A small sample of sites promoting self fertile rose family fruit trees