
China cultivated land change and its carbon budget measurement based on the system dynamics

Summary
As a result of industrialization, an increasing proportion of China’s cultivated land is being urbanized, causing considerable environmental damage.
In an endeavour to promote a low-carbon economy, this article focuses on modeling the carbon budget resulting from the industrialization and urbanization of farmland from 1996 to 2020, using empirical analysis and a dynamic system.
The results show that, the area of China’s cultivated land is decreasing, whereas, land is being built on at a much faster rate.
The analysis indicated that the area of cultivated land decreased from 1.293 million km2 in 1996 to 1.204 million km2 in 2020, whereas 0.499 million km2 were likely to be built on by 2020 rising from 0.204 million km2 in 1996.
The data indicated that, the rate at which cultivated land is lost is faster in the eastern region than in the central, western and north-eastern regions, indicating that the conversion is concentrated in the east of China.
Carbon budget measurements indicate that nationally the carbon sink is likely to decrease from 0.79 billion tonnes in 1996 to 0.748 billion tonnes in 2020, and the carbon source is likely to increase from 9.34 billion tonnes in 1996 to 11.7 billion tonnes in 2020.
The loss of cultivated land finally indicates that the carbon budget is the largest in the east (5.03 billion tonnes, 48% of the national total), 2.28 billion tonnes in the west, 22% of the total, 2.17 billon tonnes in the central region, 22% of the total, and 1.08 billion tonnes in the northeast, 10% of the total.
It is concluded that cultivated farmland should be continually protected to act as carbon sinks, and that it will be crucial to maintain a constant carbon budget. Government is required to strictly control industrial building on land, optimize energy efficiency, and retard carbon emissions.
Key words
cultivated land conversion; carbon sink; carbon source; carbon budget; china
Introduction
Most countries have experienced the processes of industrialization and urbanization, with the consequential loss of cultivated land.
This land feeds mankind, so it is essential to a country's food security and social stability, functions which cannot be replaced.
China’s cultivated land resources are scarce, possessing a relatively low per capita area (only 0.095 ha) of low quality (low and mid yield cropland accounted for 65%).
Cultivated land is decreasing annually from 1.301 million km2 in 1996 to 1.217 million km2 in 2008, a loss which was greatest in 2002 and 2003, when cultivated land area decreased respectively by 1.33 million ha and 2 million ha [1].
The rapid decline in land available for cultivation to a critical quantity of 1.2 million poses a serious threat to the country’s economic development and food security.
On October 23, 2008, the central government published the “A national land use planning outline, 2006-2020”, which proposes that in 2010 and 2020 there should be 1.212 million km2 and 1.203 million km2 of cultivatable land, respectively.
According to the evidence [1-6], with each 1% increase in urbanization, the city built area increases by 102 thousand ha, and cultivated land is reduced by 410 thousand ha out of a total of 0.122 billion ha of cultivated land in China.
Thus industrialization and urbanization has caused a huge loss of cultivated land, threatening the food security of China.
There has been much research on the quantity and quality of cultivated land. Its conversion to urban use has been of concern to policy makers and scholars since the 1990’s.
The rural land requisition system[3], the current cultivated land conversion process, a policy analysis of cultivated land conversion[4-6], the relationship of economic development to cultivated land conversion[7-11], and the relation between cultivated land conversion and food security[12-15], have all been discussed at length.
Publication of the “United Nations Framework Convention on climate change” and the “Kyoto Protocol”, on a low carbon economy become important topics for research, especially theoretical analyses on, for example, the carbon capture of specific plant species, the carbon economy coefficient of various soils[16-18], and carbon emissions of various soil and surface types[19-21].
Although the impact of cultivated land conversion on the local ecology has attracted attention, the mechanism by which the land conversion process influences the carbon sink and the carbon budget is less well quantified.
In view of this, we focus on an analysis of cultivated land conversion as it affects a low carbon economy, the carbon sink, population (the whole country, the East, mid, West and northeast.), and economic development, using the method of system dynamics.
The analysis should provide quantitative evidence to support policy decisions about non-agricultural land and the protection of China’s ecology.
2 Theory and Method
2.1 Theoretical analysis
The world resources organization’s carbon footprint calculator [22] and other estimations [16-21] indicate that between 1850 and 1998, global carbon emissions caused by land use change account for 1/3 of emissions derived from human activity; from 1950 to 2005, cumulative carbon emissions caused by Chinese land use changes was 10.6Pg, accounting for 30% of all man-made carbon emissions in China, and accounting for 12% of the global carbon emissions during that period.
From 1980 to 2005, China’s total urbanized land increased to 31.9 million ha, when the intensity and scale of carbon emission both grew rapidly. Construction land carbon emissions from land which has been built upon is several times to 100 times per unit area that of other land types.
Land use change is one of the important causes of an imbalance in the global carbon cycle, it is also the second most important human activity cause of increased atmospheric CO2 concentration, after that of the combustion of fossil fuels.
As shown in the analysis of Figure 1, unreasonable land utilization reduces soil and vegetation carbon storage, so that more carbon is released into the atmosphere, increasing the concentration of atmospheric CO2, so adding to global warming and the associated climate change.
At present, cultivated land conversion is the main reason of irreversible change of land use. The farmland ecosystem is an important component of the terrestrial ecosystem carbon pool, a most active part, which is characterized by short periods of carbon fixation and large volumes.
Green vegetation fixes carbon by photosynthesis, so acting as a carbon sink; but when soil is cultivated, or disturbed in land conversion, carbon stored in soil is released.
Once cultivated land is built on, it becomes a carbon source. From 1996 to 2006, 8.27 million ha cultivated land was built on.
The non-market value of ecology and food security are not taken into account, in the process of land conversion; hence the value of cultivated land is underestimated, so local government distorts land price, in favour of its use for buildings, leading to excessive demand for cultivated land as a resource for building, often accompanied with serious imbalance of carbon budget and a rapid growth of carbon emissions.
The measurement of carbon sink, carbon source and carbon balance caused by cultivated land conversion becomes an important basis for weighting of China’s ecology and environment.
This paper defines the mechanism of carbon source sink and carbon budget change in the process of cultivated land conversion, using a system dynamics model for national, eastern, mid, western and northeastern regions.
These areas are selected for an empirical quantitative analysis providing a decision-making basis for policy innovation of China.
2.2 Model construction
2.2.1 Thought of study
The whole environment, its economic development and population change are regarded as part of a dynamic system.
In this system, all the interactive elements have an effect on the change of cultivated land and its carbon budget of China.
The carbon budget of China, both regionally and nationwide, was subjected to an econometric analysis.
2.2.2 Introduction of method
A system dynamics was introduced by Forrest of the Massachusetts Institute of Technology in United States of America in 1956[23] to investigate complex systems by feedback control theory and an integrated qualitative and quantitative method.
It determines the structure and the dynamic behaviour of a carbon budget system by computer simulation[24-29].
For our analysis the three systems consist of farmland, construction land and the social economy.
It then simulates the dynamic behaviour of each system, and estimates by computer the rate of change of the carbon budget as the cultivated land is converted to building land.
2.2.3 Model
The cultivated land conversion carbon budget system contains many subsystems, including population, economic, grain and carbon sinks, carbon source systems, with mutual connections amongst them all (Fig. 2).
The data obtained from previous research [24-32] were analysed using system dynamics software Vensim, the cultivated land conversion carbon budget model of SD.
3 Empirical analysis
3.1 National empirical – overall judgment
3.1.1 Parameter estimation
Population, countrywide cultivated land and construction land in 1996 were the parameters selected for this analysis with trend extrapolation fitting by statistical analysis.
For instance, the urbanization level was obtained from a city’s non-agricultural population as a proportion of its total population; the coefficient for the area of farmland used as construction land is taken as the national average according to “green residential area design code”.
The carbon sink, carbon source correlation coefficients were obtained from previous research results following adjustment [16-32]; construction land green area, ecological restoration, cultivated land carbon sink coefficients were 4.24, 8.08, 5.82, construction land green area, ecological restoration, cultivated land and construction land carbon source coefficients were 3.91, 6.38, 4.66, 361.59.
The main parameters and mathematical logic relationship as shown in table 1.
3.1.2 Simulation results
According to the current trends of three variables which are people, cultivated land and construction land, using system dynamics simulation tests model, we get the reliable simulation results.
The simulation is under a rapid economic development background?the cultivated land conversion speed is accelerated, and the low carbon economy is being promoted.
The effect of cultivated land conversion’s on the carbon budget needs to be quantified. Computer simulation is used to simulate carbon source, carbon sink, carbon budget, and areas of cultivated land and construction land.
The simulation results are shown in Fig. 3. The predictions given in Fig. 3, are that the cultivated land decreases to 120.4 million hectares in 2020 from 129.33 million hectares in 1996 while the construction land increases to 30.73 million hectares from 24.07 million hectares.
The reduction of cultivated land is greater than the increase of construction land. The carbon sink decrease from 0.790 billion tonnes in 1996 to 0.748 billion tonnes in 2020. The carbon source increases from 9.34 billion tonnes in 1996 to 11.7 billion tonnes in 2020.
The carbon budget increases from 8.55 billion tonnes in 1996 to 11.0 billion tonnes in 2020. The carbon sink reduction is proportionately less than is the loss of cultivated land.
The carbon source increases proportionately faster than does the area of construction land. The carbon sink is declining and carbon source is increasing every year. Hence the carbon budget is predicted to decrease and the rate of loss to increase.
3.2 An regional comparison
China can be divided into northeast, east, center and west four regions (Fig. 5).
According to the above research methods for national, we simulated the values of the cultivated land and construction land in four regions from 1996 to 2020 (Fig. 4).
Then through computer simulation technology, simulate the carbon source, carbon sink, carbon budget amount in different year (Fig. 5).
The Fig. 4 shows that, cultivated land area in our country presents decreasing trend on the whole, construction land presents increasing state.
And cultivated land conversion speed in our country presents east> middle > East West > northeast, which reflects our country’s cultivated land conversion key area is concentrated in the eastern region.
As shown in Fig. 5, the simulation values of carbon sink will be decreasing in four regions, and the carbon source will be increasing significantly in future. The carbon budget deficit is predicted to increase, but the increase is not huge.
The carbon source and carbon budget in east will increase mostly. The carbon sink, carbon source and carbon budget will be stable in northeast.
According to Fig. 6, the proportion of Eastern region’s Carbon Budget grows continuously, from 42% in 1996 to 48% in 2020; the Northeast has been proportionately in a steady state, accounting for 10%; whereas, owing to an increase in overall carbon balance volume the proportions of Western and Central regions decreased from 1996 to 2020.
Through the above analysis and regional comparison, the national carbon budgets deficit shows an upward trend which is fastest in the East, and least in the Northeast.
4 Conclusion and policy suggestion
4.1 Main conclusions
The carbon balance analysis of national and regional cultivated land conversion lead to the following conclusions:
(1) The area of cultivated land in China is decreasing at a greater rate than the, construction land is increasing. The analysis predicts that the cultivated land area will decrease from 129.33 million ha in 1996 to 120.4 million ha in 2020, whereas the construction land area is predicted to increase from 24.07 million ha in 1996 to 30.73 million ha in 2020.
(2) The rate at which regional cultivated land is predicted to be converted to building land is in the order: East > Central > West >Northeast. The Eastern region is likely to be subjected to a reduction in its carbon sink of cultivated land from 0.79 billion tonnes in 1996 to 0.748 billion tonnes in 2020, as its carbon source is likely to increase from 9.34 billion tonnes to 11.7 billion tonnes in 2020.
(3) The annual carbon budget of cultivated land conversion for China indicates an increasing trend. Prediction of carbon budgets in 2020, indicate they are largest in the East, with 5.03 billion tonnes, constituting 48% of countrywide carbon budget, second in the West with 2.28 billion tonnes, or 22% of the total. The Central region would be slightly less than the West, with 2.17 billion tonnes, or 20% of the total. The carbon budget of the Northeast is the smallest of 1.08 billion tonnes, or 10% of countrywide total.
Cultivated land conversion is a complex system. The reliability of the estimates of future carbon budgets is restricted by the assumptions made, and the accuracy of the parameters. The reliability of the predictions declines with increasing future time. The author’s original intention was to associate the cultivated land conversion with the low carbon economy and apply a dynamic system framework. In this we measured the quantitative ecological effects of cultivated land conversion on the environment in various areas of China, to raise greater concern from other scholars and the Central government
4.2 Policy proposals
Based on the above conclusions, the following policies have been proposed.
(1) In order to reduce net emissions of carbon dioxide in the atmosphere, farmland protection strength should be enhanced; but presently the Eastern region is a key area of cultivated land conversion in China where farmland protection should be more strongly empowered. The area of vegetation should be continuously checked and not further reduced. Full use should be made of farmland, especially grassland and of forest as a carbon sink. While protecting cultivated land, we should increase ecological land area ratio and forest cover by a variety of methods, including the planting a mix of coniferous and broad leaved trees and shrubs,needle leaf mixed forest, shrub and tree to increase net production.
(2) The scale and intensity of building on land should be to strictly controlled. At present, the rapid development of construction in China will cause increased energy consumption and carbon emissions making the goal of carbon emission reduction difficult to achieve. Therefore, the main tasks are to regulate construction land scale expansion and improve its intensive use.
(3) The role of government is paramount in regulating and developing a low carbon economy and renewable sources of energy. In order to realize sustainable energy utilization of society, we propose that the reduction of emission targets of cultivated land conversion should be taken into the region construction planning of each province, industrial structure should be adjusted continuously, a low carbon industry and renewable energy sources which greatly contribute to GDP should be vigorously encouraged. Moreover, effort should be made to encourage the adoption of a low carbon life style.
Acknowledgements
We thank anonymous referees for very helpful comments. And also thank National Natural Sciences Foundation of China (71473249, 51474214, U1361214); National science foundation work special key project (2014FY110800); China Post-doctoral Foundation (2011M500098, 2013T60577); A Project Funded by the Priority Academic Program Development of Jiangsu Higher Education Institutions (SZBF2011-6-B35); Graduate Innovation Project of Jiangsu Province(KYZZ_0389) for the financial support.
References
[1] Li Xiao-shun,Qu Fu-tian,Tan Rong, et al. Research on the variations and protection of the cropland in China – based on the perspective of land supervision[J]. Journal of Natural Resources, 2009, 24(3):387-401. (in Chinese)
[2] Zhang Xiu-mei, Li Sheng-feng,Huang Xian-jin, etc. Effect of Carbon Emissions and Their Spatio-Temporal Patterns in Jiangsu Province from 1996-2007. Resource Science, 2010 (4):768-775(in Chinese).
[3] Zhu Lin-xing. The preliminary of rural land rent Expropriation. The Study of Finance and Economics, 1991 (6):38-41(in Chinese).
[4] Qu Fu-tian, FENG Shu-yi, etc. Instituting Arrangements, Price System and Farmland Conversion[J]. China Economic Quarterly, 2004, 4 (1):229-248. (in Chinese)
[5] Tan Yong-zhong, Wu Ci-fang, Mu Yong-ming. Macro-Analysis of Cultivated land Non-Agriculturalization in Zhejiang. Scientia Geographica Sinica, 2004 (1):14-19. (in Chinese)
[6] Song Wei, Chen Baiming, Zhang Ying. Land-use change and socio-economic driving forces of rural settlement in China from 1996 to 2005. Chinese Geographical Science, 2014, 24 (5): 511-524. (in Chinese)
[7] Qu Fu-tian, CHEN Jiang-long, CHEN Hui-guang.Economic development and farmland conversion [M].Beijing: the Commercial Press, 2007, 1-2. (in Chinese)
[8] LiuQing, Chen Li-gen, Zhang Feng-rong. Econometric Analysis of Relationship between Cultivated land Conversion Quantity and Economic Developments in China. Resources Science, 2009 (5):787-793. (in Chinese)
[9] Li Hai-peng, YeHui, Zhang Jun-biao. Study on the Relationship between the Income Disparity and Cultivated land Conversion in China: Extensions of Cultivated Land Kuznets Curve. China Land Science, 2006, 20 (5): 358-361.
[10] Huang Zhong-hua, Wu Ci-fang, Du Xue-jun. Empirical Study of Cultivated Land Change and Socio-economic Factors in China. Journal of Natural Resources, 2009, 24 (2):192-199. (in Chinese)
[11] SongGe, Wu Ci-fang, WangYang. The Granger Causality Test between Cultivated Land Conversion and Economic Development in Heilongjiang Province. China Land Science, 2006 (3):32-37. (in Chinese)
[12] Anders S, Havard S. Economic Growth and Land Use Changes: the Declining Amount of Wilderness Land in Norway. Ecological Economics, 2001, 37(2): 289-301.
[13] Zhen Lin, Deng Xiangzheng, Wei YunjieFuture. Land use and food security scenarios for the Guyuan district of remote western China. Iforest-biogeosciences and Forestry, 2014, 7: 372-384.
[14] Shoshany M, Goldshleger L. Land Use and Population Density Changes in Israel 1950 to 1990: Analysis of Regional and Local Trends[J].Land Use Policy, 2002, 19 (2): 123-133.
[15] Tan Rong, Qu Fu-tian. Farmland conversion and protection: from dilemma to win-win situation [J].Management World, 2006, (12):50-59. (in Chinese)
[16] Chuai Xiaowei, Huang Xianjin, Lai Li. Land use structure optimization based on carbon storage in several regional terrestrial ecosystems across China. Environmental Science & Policy, 2013, 25: 50-61.
[17] ZhangAn, Li Xue-rui, XuJian. Research of Urban Microscopic Land-utilization Influence on Carbon-emission Evaluation – A Case Study on a Unit in Nanjing. Economical Economy, 2009 (1):27-30. (in Chinese)
[18] Kuang Yao-qiu, Ou Yang ting-ping, ZhouYi, etc. Present Situation of Carbon Source and Sink and Potential for Increase of Carbon Sink in Guangdong Province. China Population, Resources and Environment, 2010 (12):56-61. (in Chinese)
[19] Yang Qing-yuan. Land Use Changes and the Carbon Cycling. China Land Science, 2010 (10):7-12. (in Chinese)
[20] LiYing, Huang Xian-jin, ZhenFeng. Effects of Land Use Patterns on Carbon Emission in Jiangsu Province. Transactions of the Chinese Society of Agricultural Engineering, 2008 (S2):102-107. (in Chinese)
[21] Aguiar M I, Fialho J S, Campanha M M. Carbon sequestration and nutrient reserves under different land use systems. Revista Arvore, 2014, 38(1): 81-93.
[22] Houghton R A, Hackler J L. Emissions of carbon from forestry and land-use change in Tropical Asia. Global Change Biology, 1999,5(4): 481-492.
[23] Wang Gang. Study on sustainable utilization ability evaluation based on system dynamics. Hangzhou:Zhejiang University, 2006: 24. (in Chinese)
[24] Tang Gong-shuang. A research of interaction of Cropland-Population-Grain System in Shandong Province. Shandong Economics, 2007 (4):144-147. (in Chinese)
[25] Zhang Hong. Study On Food Security Problem In China Based On System Dynamics. Chengdu: Chengdu University of Technology, 2009: 22-40. (in Chinese)
[26] Tan Shu-kui, Zhang Lu, Qi Rui. Research on Regional Pressure Index of Cultivated Land Based on System Dynamic – A Case Study of Hubei Province Journal of Natural Resources, 2012, 27 (5): 757-765. (in Chinese)
[27] Chen Ban-qin, Wang Xiao-ke. Terrestrial Ecosystem Carbon Budget and Countermeasures of Increasing in China. Beijing: Science Press, 2008. (in Chinese)
[28] Tans P P, Fung I Y, Takahashi T. Observational constraintion the global atmospheric CO2 budget[J]. Science, 1990, 247: 1431-1438.
[29] Fang Jing-yun, Liu Guo-hua, Xu Song-lin, Etc. Biomass and Net Production of Forest Vegetation in China. Acta Ecologica Sinica, 1996, 16 (5): 497-508.
[30] He Hong-tao, Yuan Wen-xian. The Carbon Emission Reduction Measures and Effect Analysis in Cement production. China Building Material Equipment, 2005, 3:47-49.
[31] Zhang Chun-xia, Hu Chang-qing, Yan Ding etc. GHC Emission and Its Mitigation of Steel Industry. China Metallurgy, 2007, 17 (1): 7-12.
[32] Seto K C, Kaufmann R K. Modeling the Drivers of Urban Land Use Change in the Pearl River Delta, China: Integrating Remote Sensing with Socioeconomic Data [J]. Land Economies, 2003, 79 (1): 106-121.
Download pdf
Figures
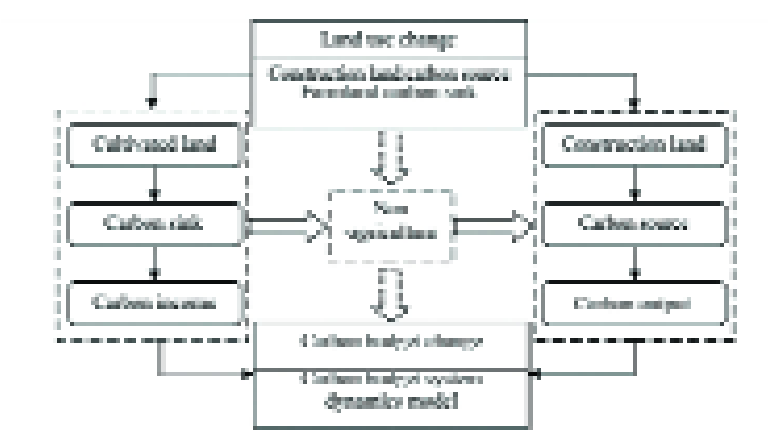
Fig 1. The theoretical analysis framework of the cultivated land conversion carbon budget
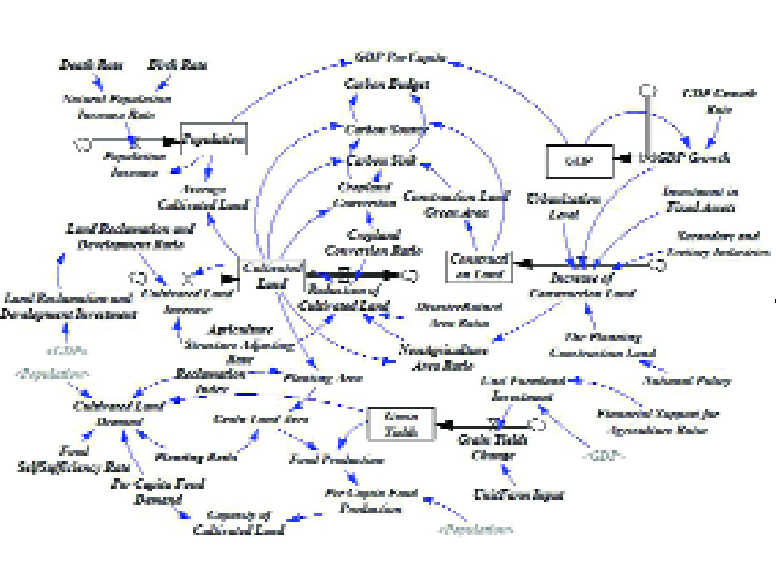
Fig 2. The flow chart of the cultivated land conversion carbon budget system model
Note: Because new construction land mainly comes from the cultivated land in China, the relationship in the model between construction land and cultivated land is mainly established through the index of the occupied cultivated land proportion in the new construction land. For the regional differences, the proportions of the national, West, East, Center and Northeast are the average values over previous years.
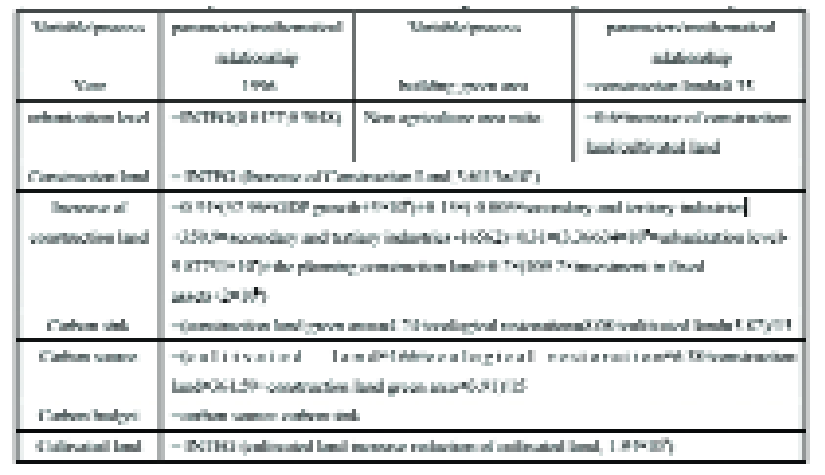
Table 1. The main parameters and mathematical logic relationship in simulation analysis
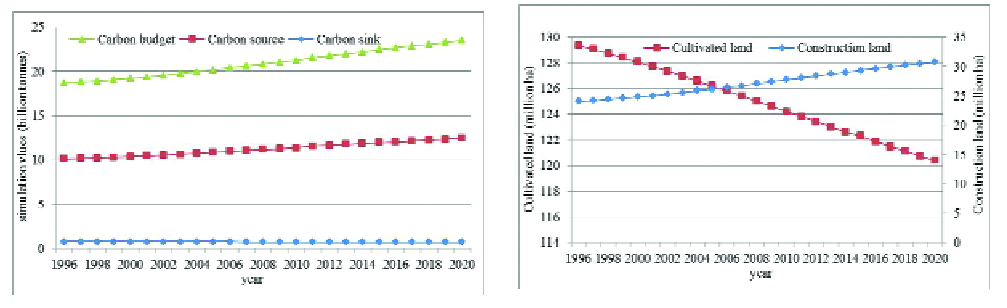
Fig 3. The chart of simulation results
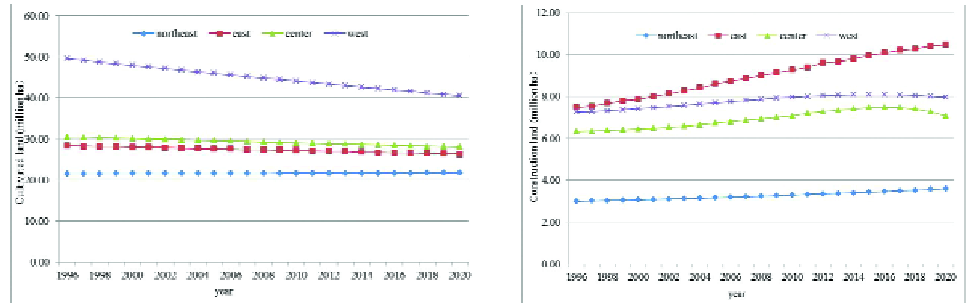
Fig 4. The simulation value chart of the cultivated land and construction land in four regions
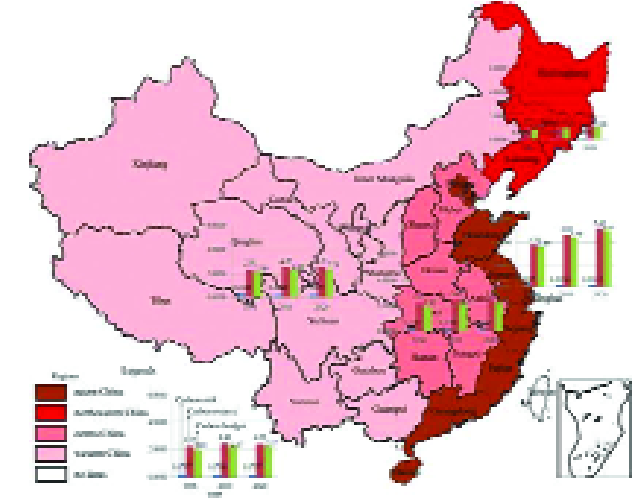
Fig 5. The regional carbon sink, carbon source and carbon budget in 1996, 2010 and 2020. As shown in Fig. 5, the simulation values of carbon sink will be decreasing in four regions, and the carbon source will be increasing significantly in future. The carbon budget deficit is predicted to increase, but the increase is not huge. The carbon source and carbon budget in east will increase mostly. The carbon sink, carbon source and carbon budget will be stable in northeast.
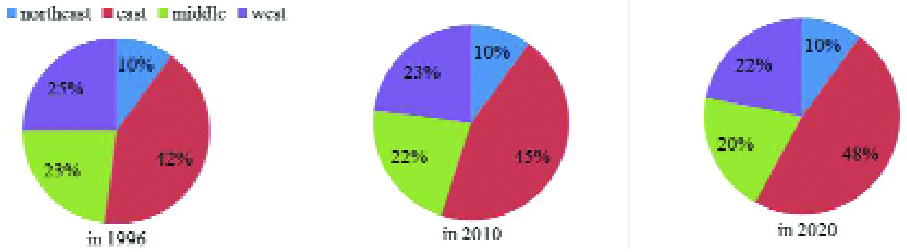
Fig 6. The proportion change of regional carbon budget in four regions from 1996 to 2020