
Nitrogen cycle and world food production
Summary
In the biosphere nitrogen has the most complex cycle of all circulating elements.
Its incessant reuse makes life on Earth possible. Traditional agricultures supplied limited amounts of the nutrient by recycling organic wastes and by planting leguminous crops.
Only the Haber-Bosch synthesis of ammonia, first commercialised in 1913, removed this key constraint on crop productivity.
Global agriculture has become steadily more dependent on synthetic nitrogenous compounds without whose applications we would not be able to produce roughly half of today’s world food.
This high, and rising, dependence exacts a considerable environmental price, as the losses of nitrogen fertilisers lead to contamination of waters, eutrophication, and excessive atmospheric deposition and emissions of a potent greenhouse gas.
Inefficient use of nitrogenous fertilisers is also an obvious economic loss and a waste of natural gas, the prime feedstock and energiser of ammonia synthesis.
There is no single measure that could substantially cut these losses but they can be reduced by careful agronomic management and (most effectively, but controversially) by moderate consumption of animal foodstuffs.
In any case, more nitrogen will be needed to feed the additional 1.5-2 billion people that will be added to the global population before its growth levels off later in this century.
Glossary
Eutrophication: degradation of water quality owing to enrichment by nutrients, primarily nitrogen (N) and phosphorus (P) which results in excessive plant (principally algae) growth and decay.
Troposphere: lowest layer of the earth’s atmosphere, below the stratosphere.
Anthropogenic: produced by human activity.
Abbreviations Gt, gigatonne, or 109 tonnes, 1012 kg. Mt, megatonne, or 106 tonnes.
Introduction
Life on Earth would be impossible without incessant cycling of key elements that make up biomass.
Three cycles – those of carbon, nitrogen and sulphur – are particularly noteworthy: carbon is, of course, the dominant constituent of all living matter (typically 45-50% of dry weight).
Proteins cannot be made without nitrogen, and disulphide bridges make the proteins three-dimensional, ready to enter into myriads of enzymatic reactions.
Proteins also act as signalling and structural compounds. The three cycles are remarkable because of their complexity, the importance of microbes in their functioning and because the cycled elements are transported by both air and water and hence able to move far away from their sources.
Relative neglect and existential necessity
Concerns about rapid global warming – anthropogenic emissions of carbon dioxide (CO2) and the resulting planet-wide rise of tropospheric temperatures and alteration of carbon cycle – have come to dominate not only media attention but also scientific debates in general and environmental concerns in particular.
A simple search of Google News reveals the information gap. In January 2011 the site listed more than 700 items for the carbon cycle but fewer than 90 items for the nitrogen cycle.
I would argue that the real public awareness gap is much greater than this, an order of magnitude difference, as the comparison includes many references to papers published in scientific journals whose content will never become widespread public knowledge.
This attention disparity is curious because human interference in the nitrogen cycle is incomparably more massive than our perturbance of the carbon cycle.
This is because most of the disruption is due to that most fundamental of all energy conversions, the production of food.
In absolute terms anthropogenic emissions of carbon from fossil fuel combustion (nearly 9 Gt C/year) are less than 10% of the annual carbon uptake by terrestrial photosynthesis.
In contrast, human activities (fertilisers, planting of legumes and emissions of nitrogen oxides from combustion) now release about as much reactive nitrogen (about 150 Mt N) as is formed by natural processes (biofixation, lightning).
There is no possibility that we will be able to produce food without nitrogen. Therefore, the nitrogen cycle and human interference in its functioning should get at least as much attention as our current (and I would argue exaggerated) preoccupation with global climate change.
Understanding the cycle
Studies of the nitrogen cycle go back to the period of pioneering research that laid the foundation of modern life sciences during the 19th century (Smil 2001).
Justus von Liebig, one of the founders of organic chemistry, formulated the law of the minimum (plant growth is limited by the element that is present in the soil in the least adequate amount), published the first concepts of global biospheric cycles and recognised the importance of nitrogen in crop production by contrasting it with forestry: Agriculture differs essentially from the cultivation of forests, inasmuch as its principal object consists in the production of nitrogen under any form capable of assimilation; whilst the object of forest culture is confined to the production of carbon (Liebig 1840).
Jean-Baptiste Boussingault (1802- 1887) found that the nutritional value of fertilisers is proportional to their nitrogen content and demonstrated that legumes can restore nitrogen to the soil. John Bennet Lawes (1814- 1900) and Joseph Henry Gilbert (1817-1901) initiated the first continuous experiments with crops receiving different amounts of fertilisers and demonstrated, beyond any doubt, that nitrogen fertilisers (followed by phosphates) are the key to higher grain crop yields. In 1877 Théophile Schloesing (1824-1919) proved the bacterial origins of nitrification, in 1885 Ulysse Gayon (1845-1929) and his assistants closed the cycle by finding denitrifying bacteria that can reduce nitrates and, via NO and N2O, return N2 to the atmosphere.
In 1886 Hermann Hellriegel (1831-1895) and Hermann Wilfarth (1853-1904) solved the mystery of leguminous nodules as the sites where biofixation (conversion of atmospheric N2 into NH3) takes place.
The nitrogen cycle (Fig 1) and its key role in agricultural productivity were thus well understood by the end of the 19th century and this very knowledge led to growing concerns about future harvests: where will the countries with growing populations and with rising demand for better nutrition get the additional nitrogen needed to sustain higher crop yields?
None of the options available during the 1890s could solve the challenge. Traditional recycling of organic wastes could supply only a limited amount: the nitrogen content of these wastes is inherently low, typically less than 0.5% in cereal straws, 2-4% in animal manures, and nitrogen losses before and after their application are high.
These facts necessitate massive labour- intensive applications of farmyard manures in amounts commonly in excess of 10 t/ha.
Bird guano has a higher N content but its resources were limited. Chilean nitrates contain about 15% N but their exports could satisfy only a small share of the potential global demand.
Moreover, the first synthetic products, ammonium sulphate from coking and synthetic cyanamide (CaCN2) were also available only in limited quantities and were rather expensive.
Synthetic fertilisers and food production
All this changed with unexpected rapidity just before the outbreak of World War I.
In early July 1909, after years of intensive experiments, Fritz Haber (1868-1934) succeeded in synthesising ammonia from its elements with the help of an iron-based catalyst (Smil 2001; Stoltzenberg 2004).
Within four years of this laboratory bench demonstration, BASF, Germany’s largest chemical company, had a commercial process ready: Carl Bosch (1874-1940) was the engineer responsible for this remarkable achievement.
Haber-Bosch synthesis of ammonia made it possible to mass-produce inexpensive nitrogenous fertilisers but their use remained limited during the inter-war years.
Ammonia synthesis took off only after World War II, its global output rising from3.7MtNin1950to85MtNby the year 2000 and to about 133 Mt in 2010, with about 75% of the total used as fertiliser (Table 1).
European, North American and Japanese agricultures were the first beneficiaries of inexpensive nitrogenous fertilisers. By the 1960s rising nitrogen application made it possible to realise high yields of new short-stalked wheat and rice cultivars planted in low-income countries of Asia and Latin
America. Eventually China, the world’s most populous country, became, and remains, the largest user as well as the largest producer of synthetic nitrogen (FAO 2011).
The role of synthetic nitrogenous fertilisers – initially a variety of compounds, most recently dominated by urea – is perhaps best illustrated by comparing typical grain yields in 1900 with the year 2000.
In 1900 traditional cultivars received virtually no synthetic nitrogen fertilisers, whereas in the year 2000 high-yielding cultivars were grown with an adequate nitrogen supply (Smil 2011).
This, together with advances in breeding (producing short-stalked cultivars with high harvest indices) and chemical protection (herbicides and pesticides) has more than tripled the average US wheat yields during the 20th century and the analogical multiples are 5.8 for France and 3.8 for China. in the USA average yield of corn, the country’s most important field crop, rose more than five-fold during the 20th century, from 1.6 t/ha to 8.5 t/ha.
Japan’s average rice yield, already relatively high in 1900 (2.2 t/ha), increased nearly three times before reaching a plateau between 5.8-6.5 t/ha during the 1980s. Nationwide yield maxima for rice are 6-8 t/ha, in East Asia and California.
With average crop yields remaining at the 1900 level the crop harvest in the year 2000 would have required nearly four times more land and the cultivated area would have claimed nearly half of all ice-free continents, rather than under 15% of the total land area that is required today (Smil 2011).
A different perspective has been quantified by Burney, Davis and Lobell (2010): they calculated that between 1961 and 2005 increased crop yields had a net effect of avoiding emissions of up to 161 Gt C. At the same time, these high levels of production have made modern cropping highly dependent on constant inputs of nitrogen (Table 1) supplemented by phosphorus, potassium and micronutrients.
Synthetic nitrogenous fertilisers now provide just over half of the nutrient received by the world’s crops; the rest comes mostly from natural and managed (leguminous crops) biofixation, organic recycling (manures and crop residues) and atmospheric deposition.
Without the use of nitrogen fertilisers we could not secure enough food for the prevailing diets of nearly 45% of the world’s population, or roughly three billion people.
These diets are excessive in rich countries, adequate in China, but inadequate in much of Africa. The reason for this is that about 85% of all food protein comes from cropping, whereas only 15 % is derived from grazing and aquatic catches.
In China synthetic fertilisers already account for more than 60% of all nitrogen inputs (Ma et al. 2010) as they do in India (Pathak et al. 2010).
By 2025 more than half of the world’s food production will depend on Haber- Bosch synthesis, and this share will keep rising for at least several more decades. Unfortunately, this will cause even greater nitrogen losses in the environment.
Inefficient fertilisation and its environmental impacts
Low fertiliser prices and the quest for maximum yields led to steadily higher applications of nitrogenous compounds, now commonly exceeding 100 kg N/ha for the most productive wheat, rice and corn crops.
Two main factors have changed that trend: (1) higher prices, reflecting the higher cost of natural gas (after World War II methane (CH4) largely displaced coal hydrogenation as the main source of hydrogen and it also became the principal energiser of the Haber-Bosch process) and (2) concerns about intensifying environ- mental impacts.
Inherent complexity of the nitrogen cycle and the ubiquitous roles of bacteria in its functioning present many routes for undesirable losses from an agroecosystem receiving high nitrogen applications (Bothe, Ferguson and Newton 2007).
Volatilisation, leaching, soil erosion and denitrification usually claim most of the applied nutrient.
Although grain crops can recover as much as 85-90% in small-scale experiments using 15N- labelled fertiliser (Krupnik et al. 2004), actual field recoveries are rarely above 50%.
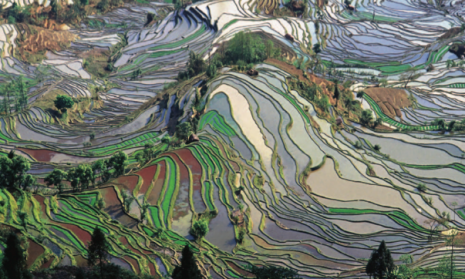
Nitrogen use efficiencies in major EU agricultures range from just 38% in France and the Netherlands to 42% in Germany and 44% in Italy (Oenema et al. 2009). In China’s paddy fields (Plate I) typical losses are still higher: even with optimised applications they can exceed 70% and with traditional applications they can be more than 80% (Fan et al. 2007).
Consequences of these losses have been well documented (Sutton et al. 2011): leaching of nitrates into ground water, rivers, ponds and lakes; expanding dead zones in coastal ocean waters, resulting from recurrent eutrophication; atmospheric deposition of nitrates and ammonia affecting natural ecosystems; higher emissions of nitrous oxide (N2O), now the third most important greenhouse gas following CO2 and CH4.
The global extent of these losses is bound to increase because at least three billion people need substantially better diets and hence higher nitrogen applications to their food crops.
The need is most obvious in sub-Saharan Africa where typical fertiliser application rates are an order of magnitude below the recommended levels (Goulding, Jarvis and Whitmore 2008).
Of course, our dependence on synthetic nitrogenous fertilisers could be cut if we chose to reduce our intakes of animal foodstuffs – but it will grow, as dietary transitions change the pattern of typical food consumption in the opposite direction.
Dietary transitions and demand for nitrogen
Rising incomes, urbanisation and industrialisation, the higher participation of women in the labour force and decreasing size of families, has led to a universal transformation of traditional diets.
These diets, dominated by a few staple cereals, legumes and tubers, are changing to diets with much lower shares of all staple foods, but with a higher consumption and greater variety of vegetables and fruits and, above all, with much higher intakes of meat, dairy products, eggs and aquatic species.
While the speed of this transition has been highly country specific the eventual outcome always results in a much higher demand for nitrogen.
Very few countries can secure most of the additional protein demand by grazing or by increased fish catch and the only option is a much expanded cultivation of feed crops, now globally dominated by corn and soybeans, or their import.
Inherent inefficiencies of animal metabolism mean that the countries with a high per capita meat supply have the diets with the highest nitrogen cost (that is the lowest overall nitrogen use efficiency).
Spain is now the European leader with an annual supply of about 110 kg of meat/capita, while the US supply averages more than 120 kg/capita. Moreover, the nitrogen cost is excessive in those countries where average efficiency of fertiliser uptake by plants remains below what should be achievable by good agronomic practices.
My calculations show the overall nitrogen efficiency of the global food system to be no more than 15%, the US rate is no better than about 12% (Howarth et al. 2002) and Ma et al. (2010) calculated the ratio for China’s food supply to be only about 9%.
Obviously, even relatively small reductions in the average meat consumption would have notable effects on overall nitrogen losses. But in the absence of higher meat costs, or
lower average incomes, this is not a popular course to follow. This leaves us with better agronomic management, a portfolio that includes split applications and balanced use of fertilisers, precision farming, optimised crop rotations, low-protein animal feeding and the use of expensive slow- release compounds: some of these measures have already helped to lower nitrogen losses in the EU (Oenema et al. 2009), US and Japan – but much more will have to be done in order to reconcile future needs for more nitrogen with the quest for high environmental quality.
References
Bothe, H., Ferguson, S.J. and Newton, W.E. Biology of the nitrogen cycle. Amsterdam, Elsevier, 2007. ISBN 9780444528575
Burney, J., Davis, S.J. and Lobell, D.B. (2010). Greenhouse gas mitigation by agricultural intensification. Proceedings of the National Academy of Sciences 107, 12052-12057.
Fan, M, Fan, Shihua ,L., Rongfeng, J., Xuejun L., Xiangzhong, Z., Keith, W., Goulding, T. and Fusuo, Z. (2007). Nitrogen input, 15N balance and mineral N dynamics in a rice–wheat rotation in southwest China. Nutrient Cycling in Agroecosystems 79, 255–265.
FAO (Food and Agricultural Organization) (2011). FAOSTAT: Fertilizers. http://faostat.fao.org/site/575/default. aspx#ancor
Goulding, K., Jarvis, S. and Whitmore, A. (2008). Optimizing nutrient management for farm systems. Philosophical Transactions of the Royal Society B 363, 667-680.
Howarth, R.W., Boyer, E.W., Pabich, W.J. and Galloway, J.N. (2002). Nitrogen use in the United States from 1961-2000 and potential future trends. Ambio 31, 88-96.
Krupnik, T. J., Six, J., Ladha, J. K., Paine, M. J. and van Kessel, C. (2004). An assessment of fertilizer nitrogen recovery efficiency by grain crops. In: Agriculture and the nitrogen cycle. Assessing the impacts of fertilizer use on food production and the environment (A. R. Mosier, J. K. Syers and J. R. Freney, eds). SCOPE 65, 193–207. Washington, DC, Island Press.
Liebig, J. von. Chemistry in its applications to agriculture and physiology, p.85. London, Taylor & Walton (1840).
Ma, L., Ma, W.Q., Velthof, G.I., Wang, F.H., Qin, W., Zhang, S. and Oenema, O. (2010). Modeling nutrient flows in the food chain of China. Journal of Environmental Quality, 39, 1279-1289.
Oenema, O., Witzke, H.P., Klimont, Z., Lesschen, J.P. and Velthof, G.L. (2009). Integrated assessment of promising measures to decrease nitrogen losses in agriculture in EU-27. Agriculture, Ecosystems and Environment 133, 280-288. I Pathak, H., Mohanty, S., Jain, N. and Bhatia, A. (2010). Nitrogen, phosphorus, and potassium in Indian agriculture. Nutrient Cycling in Agroecosystems 86, 287-299.
Smil, V. Enriching the Earth: Fritz Haber, Carl Bosch, and the transformation of world food production. Cambridge, MA, The MIT Press, 2001. ISBN 0-262-19449-X
Smil, V. Harvesting the biosphere: How much we have taken from nature. Cambridge, MA, The MIT Press, 2011. In press. I Stoltzenberg, D. Fritz Haber: Chemist, Nobel laureate, Jew. Philadelphia, Chemical Heritage Press, 2004. ISBN 0- 941901-24-6
Sutton, M.A., Howard, C.M., Erisman, J.W., Billen, G., Bleeker, A.,Grennfelt, P., van Grinsven, H. and Grizzetti, B., (eds.) The European Nitrogen Assessment: Sources, effects and policy perspectives. Cambridge, Cambridge University Press, 2011. ISBN: 978110700612
Download pdfFigures
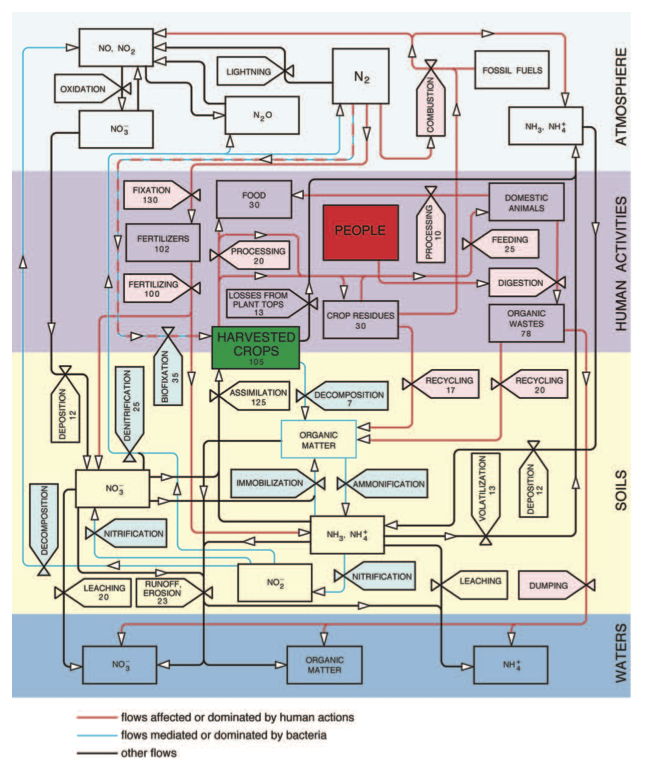
Fig 1 Nitrogen cycling in the global agroecosystem. Stores are shown as rectangles and flows as valves. The cycle is subdi- vided into its three principal environmental compartments (atmosphere, soils and waters) and all flows affected or domi- nated by human actions (and hence the targets of possible efficiency improvements) are shown in red while the flows mediated or dominated by bacterial metabolism are in blue. The latest available crop production, livestock and fertilizer statistics from FAO and IFA and nitrogen contents from Smil (2001) were used to calculate the stores and flows as annual averages for the period 2005-2009. Their accuracy varies from high (fertilizers, food) to poor (runoff, denitrification). Food (30 Mt N) corresponds to average global per capita daily intakes of 50 g of plant and 25 g of animal protein (excluding aquatic species). The difference between fixation and fertilizers is ammonia used as feedstock in chemical syntheses.
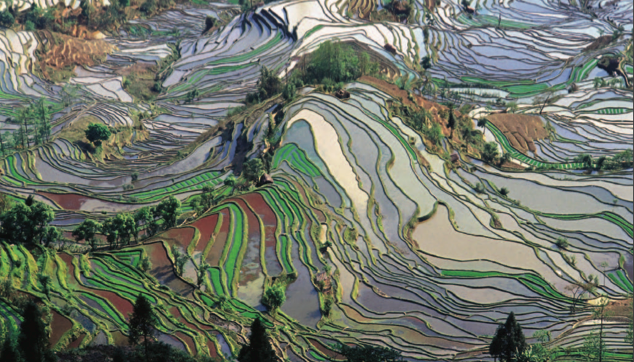
Plate 1: Rice fields in terraced hills of South China's Yunnan province: Asia's rice cultivation benefits from high nitrogen applications but it has generally low nitrogen use efficiency, often less than 30%, due to high leaching and denitrification losses. Photograph: Jialiang Gao
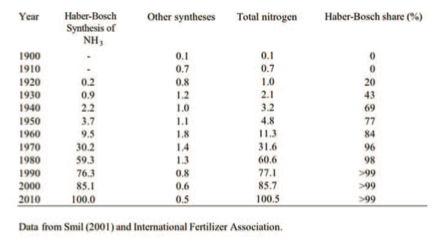
Table 1: World production of synthetic nitrogenous fertilisers, 1900-2010 (all values are in Mt N/year rounded to the nearest 100,000 t)