
Peak phosphorus: implications for agriculture

Summary
Phosphorus (P) is as essential to agriculture as it is to life. Contrary to predictions of ‘peak P’ and a looming crisis in P supply, recent studies show that rock phosphate (RP) reserves will last for centuries. Mine production capacity is approaching the long-term demand for P, which is expected to plateau mid-century and then decline as global popu- lation stabilises and the demand for P in developing countries declines, as it has in many developed countries in recent decades. Nevertheless, there is no room for complacency about RP supply, as major reserves are held by only a few countries and there are significant geopolitical and trade issues to be managed if all farmers are to have equitable access to P-fertilizer. Despite plentiful reserves, careful stewardship is needed to ensure P supplies into the distant future. Global P budgets identify possible areas for reducing consumption, but the potential for on-farm actions to reduce long-term use of RP-based fertiliser are limited, other than by reducing P losses from soil erosion through imple- menting reduced or zero tillage (for all of its other benefits). Significant P losses in surface runoff will be minimised by balancing fertilizer inputs with farm outputs once soil P has been raised to near the critical concentrations for econom- ic production. Most strategies to improve fertilizer efficiency will improve profitability without reducing long-term P demand.
Keywords: Rock phosphate, phosphorus, P-fertiliser, Peak P, P-efficiency, agronomy
Abbreviations Phosphorus (P), rock phosphate (RP), International Fertiliser Development Centre (IFDC), Global Phosphorus Research Initiative (GPRI), US Geological Survey (USGS)
Introduction
The price of rock phosphate (RP) briefly shot up 8-fold in 2007/08, appearing to vindicate claims that the world had passed “Peak P” and that reserves would be exhausted within decades (Déry and Anderson 2007). The term ‘Peak P’ (or Peak oil) refers to the maximum rate of resource extraction, said to occur when half the total reserve has been depleted (Hubbert, 1949) and to herald great price volatility as the resource becomes more difficult and expensive to extract.
In a widely-cited but different approach to Peak P analysis, Cordell et al. (2009) provided only slightly less pessimistic forecasts, calling for urgent action to reduce consumption of RP and the threat to world food supplies. The life of RP reserves is undeniably important, given that P is essential for all life and P- fertilizer is essential to sustain food production. P is non- substitutable and reserves are finite and essentially non-renewable.
The story of P may not be as clear-cut as the pessimists portray. Déry and Anderson (2007) believed that RP production had peaked at 150 Mt in 1989, yet it rose to 176 Mt in 2010 and the USGS predicts it will reach 228 Mt by 2015 (Jasinski 2011). The 2007/08 price spike had nothing to do with peak P, but other events affecting both supply and demand (Cornish 2010). Supply was constrained by temporary fertilizer factory closures and China imposing a 175% tax on P exports (now removed). Demand was fuelled by population growth, rising affluence and growing demand for meat, and
crop area expansion in response to shrinking world grain stocks and a rising demand for biofuels. Further uncertainties about the forecasts of ‘Peak P’ arise from uncertainties about the values used for the size of the global reserve, which were USGS esti- mates made before a recent four- fold increase to 65 000 Mt (Jasinski 2011).
The prospect of exhausting RP reserves raises critical questions for agriculture that are consid- ered in this paper. Is the reserve of high grade RP really diminishing so fast that a shortage of P will impact on farmers and glob- al food security in the foresee- able future, or are there other more urgent drivers of P-efficiency? How might P efficiency be improved if this is an imperative, both at the farm level and in relation to the global P-balance?
Rock phosphate reserves and reserve life Supply considerations
The size of the reserve
The total resource comprises the ‘reserve’ that can be mined economically with existing technology, and the ‘reserve base’ that is now marginally economic or sub- economic but likely to be mined with new technology or at greater economic and/or environmental cost. There are environmental issues to be addressed when exploiting lower- grade reserves (Cordell et al. 2009).
The USGS has discontinued publication of reserve base estimates, but last reported it was around three times the reserve (Jasinski 2009). The total resource also includes the ‘inferred reserve base’, an additional less well-proven resource including large deposits of low grade ore that are technically accessible with new technology.
The average estimate of the total resource is around six times the economic ‘reserve’ (Van Vuuren et al. 2010), excluding vast seabed deposits. Uncertainty about these estimates makes it difficult to confidently forecast reserve life. The USGS increased their ‘reserve’ estimate from 16 000 Mt in 2009 to 65 000 Mt in 2010 (Jasinski 2011). This followed a study by Kauwenbergh (2010) that now seems a defensible foundation for estimating reserve life.
In the most recent estimates of eco- nomic reserves, three-quarters are in Morocco/Western Sahara and the rest is distributed amongst only seven countries (Table 1). Neither Western Europe nor South Asia has useful reserves, making them particularly vul- nerable to any interruption in supply. Morocco/Western Sahara now meets 15% of global demand for RP. This share will grow as other reserves are depleted over coming decades.
Questions have been raised about the legality of Morocco’s occupation of Western Sahara and the longer-term security of this supply. Apart from geopolitics, there are trade issues. China has become a significant suppli- er of P-fertilizer to world markets, but has already shown a propensity to impose tariffs to manage P-exports for its own purposes.
Mine production capacity and RP price
Global production of RP in 2010 was 176 Mt (Table 1). Major new mines opened in 2010-2011 in Peru (3.9 Mt RP/year) and Saudi Arabia (5 Mt/year). By 2015, production and processing capacity is expected to exceed 228 Mt (Jasinski 2011). This suggests global production capacity will be adequate for the foreseeable future, but does not rule out regional deficits, geopolitical uncertainties, or trade manipulation.
Adequate production capacity takes some pressure off RP price, but the quality of known deposits is falling, so rising processing costs will apply upward pressure. Price forecasts are very uncertain, although von Horn and Sartorius (2009) predict that RP will be in the range US$100-120/t by 2030 (indexed to 2009). If so, then rising prices are unlikely to threaten food security within the next 20-30 years, but as recent events show, future short-term price/supply prob- lems can’t be ruled out.
The demand for P
Over the past 35 years, global demand for RP has doubled, outstrip- ping population growth of 65%. Growth in demand has been confined to developing countries, where P-fer- tiliser usage now far exceeds the developed world (Table 2). P use in developing countries increased 5-fold in the last 20 years, reflecting low initial soil fertility due to previously inadequate fertilizer use, rising populations and food demand, changing diets, and the economic capacity to apply more fertilizer. That rate of increase over the next 20 years would critically stress the capacity to supply fertilizer P, but this is unlikely as the evidence from developed countries shows.
In developed countries, P-fertiliser use tends to have fallen over three decades, and in the EU to have fallen quite sharply (Fig. 1). The EU and the USA together make up almost 80% of the P demand of developed economies. Even in Australia where much of the arable land was inherently infertile, demand peaked at ~500 kt fertilizer-P in 1998 and has fallen since to <400 kt P/year.
Stable or declining demand in developed economies reflects past high P rates and raised fertility levels. Environmental concerns about P in water runoff associated with excessive P in soils has also mod- erated demand. For example, water quality targets under the ‘Water quality targets under the ‘Water Framework Directive’ (Directive 2000/60/EC of the European Parliament) have led to reduced applications of P fertilizer and manure in much of the EU. Improved technolo- gy for fertilizer management has also reduced demand for fertilizer, as farm- ers use P more efficiently.
Vitousek et al. (2009) show that application rates in developed economies have followed a trajectory over time from too little, to (apparent- ly) too much, and then to a more bal- anced fertilizer regime.
Predicted demand
Most short-term forecasts indicate growth of ~2% in E and SE Asia, 4% in S Asia and Latin America, and a disap- pointing 1% in Africa. The developed world should remain stable or to con- tinue a slow decline. In an earlier long-term prediction which has so far been close to the mark, Steen (1998) forecast demand to grow by 2% pa to the year 2030 and then plateau at ~30 Mt P/yr by 2040 (230 Mt RP) as popu- lation stabilises and soil-P requirements start to fall.
This is close to the mine production capacity expected by 2015. Vitousek et al. (2009) show that fertiliser use in China appears to be following the trajectory of developed economies, lending weight to the pro- jection that world P demand will plateau then decline.
Future demand could increase in some sub-Saharan African countries that are considering using subsidies to encourage P application. In coming decades, increased P use in Africa and rainfed agriculture in South Asia and China ideally should drive any increase in P demand. Internationally, the greatest yield gaps (actual v. potential) are in rainfed areas where increased P application may provide the greatest benefit. Irrigated areas have suffered
most from past excessive fertilizer use, and reduced P use will provide envi- ronmental and economic benefits, possibly without compromising further intensification of production.
Forecasts of reserve life
The ‘Peak P’ method
Peak P prediction uses a simple statisti- cal model based on the observation that extractive industries grow expo- nentially early in development but pro- duction falls as extraction becomes more difficult. A critical assumption is that peak supply is reached when half the total reserve remains. A Gaussian (bell-shaped) curve is fitted to histori- cal data for mine extraction, con- strained so that the area under the curve equals the estimated total resource (depleted + remaining). The future date of ‘Peak P’ and the peak rate of mine production can be pre- dicted from mine output from first production to the present. A Peak P analysis was conducted by Cordell et al. (2009). It shows a supply peak in 2030 of ~28 Mt P/year (~215 MT RP). By extrapolation, reserves are forecast to run out around 2150.
Forecasts compared
Most of the recent attention to reserve life has focused on Peak P forecasts, although the USGS has made annual forecasts by simply dividing the size of the known by the annual rate of mine production. In 2009, before increas- ing the estimated size of the reserve, the USGS forecast that economic reserves would be depleted by 2100.
These forecasts, like most others, take no account of important factors deter- mining supply and demand. The ‘most likely’ scenario in a more sophis- ticated forecast was for half the remaining reserve to be depleted by mid 21st century and for economic reserves to “last for at least 100 years” (Steen 1998).
The striking point to emerge from these forecasts, regardless of their approach, is that all say economically recoverable reserves will be effectively used by the end of this century. Agricultural scientists have warned of P shortages for many years and sought improved P-efficiency for this very rea- son (e.g. Lazenby 1976).
The above analyses used a variety of data for the size of the reserve, but all were much lower than the recent IFDC figure (Kauwenbergh 2010). By using the simple USGS approach to forecasting, the IFDC estimated a reserve life of 300-400 years. If broadly correct, then whilst resource stewardship for future generations is an important responsibility for humanity, the size of the reserve per se is hardly an urgent driver for improving P-efficiency.
Upon release of the IFDC report, the GPRI, a small group of concerned aca- demics, stated that even if the revised estimates were ‘accurate’ it would delay Peak P by only ‘several decades’. A revised Peak P analysis (Cordell et al. 2011) was used to discredit the IFDC prediction of a 300-400 year reserve life. Unlike the previous Peak P analysis of Cordell et al. (2009), in this analysis the y-axis for predicted mine production was dimensionless.
However, the predicted peak in RP production (in ~60 years) shown in the graph was almost double the actu- al 2010 production used in the model- ling (176 Mt). Without saying so, they predicted peak mine production of >310 Mt/year without considering demand, which is likely to plateau at around 230 Mt/yr by mid-century and then possibly decline.
Peak P is not an appropriate tool for forecasting reserve life because it fails to take account of demand. Clearly, the simplistic approach of the IFDC and USGS is also inadequate. A more comprehensive updated forecast is overdue.
Summary data for the size of the economic RP reserve and the present and predicted supply and demand are given in Table 3. Whilst they make a case for agriculture to manage with reduced inputs of P to maintain reserves for the very long-term, as human-kind must do, any urgency for action must come from legitimate drivers other than the global RP supply and processing capacity.
A global perspective on improving P-efficiency
Global P balances indicate where P efficiencies might be gained. They also suggest other drivers to reduce P use. A concerted effort to improve the data used in P balances and subse- quent estimates of P stocks and flows would be valuable, although without intensive data the global budgets hide important variation between regions, farms, and even between fields within farms.
A recent global P balance showed that 14.9 Mt P (115 Mt RP at an average 13% P) was mined for fertilizer in 2005 but only 3 Mt was con- sumed by humans (Cordell et al., 2009). The following discussion con- siders where the apparent ‘losses’ occur and how they might be reduced, using the data in Table 3 that were synthesized from Cordell et al. (2009).
They conceptualized a food producing system based on arable, fer- tilized land (presumably crops and pastures). Domestic animals were part of the food system, but any unfertil- ized vegetation they grazed was treat- ed as the ‘natural environment’ and not part of the system.
Total P inputs to the system of 27 Mt P/yr comprised 14 Mt P in RP-based fertilizer (0.9 Mt was lost in distribution), 0.9 Mt P in feed supplements, and 12.1 Mt P transferred into the arable system from animals grazing the natural environ- ment. As P passed through the food producing-consuming system, losses to the natural environment totaling 22.6 Mt P were accounted for. The data suggest that 4 Mt P accumulated in soil, which is discussed below with the apparent losses.
Soil erosion
The 8 Mt P/year P ‘lost’ in water-ero- sion from arable land is 30% of all P ‘lost’ from food-related human activity, although some of this will be subsoil P associated with gully and stream bank erosion (Rustomji et al., 2008). Gully erosion takes land area from food pro- duction, and is a serious matter, but the P ‘lost’ does not need to be replaced to maintain crop productivity on the remaining land. So in global P budgets, some of the P input that appears to replace P lost in erosion will actually contribute to P build up in surface soil.
Severe surface erosion (and nutrient loss) undoubtedly occurs in some agri- cultural landscapes, but in most devel- oped economies the adoption of reduced or no-tillage has dramatically reduced this erosion in what is arguably the most important although largely unheralded agricultural advance since the Green Revolution (Freebairn et al., 2006; Cornish, 2011). Clearly, the further adaptation and adoption of these techniques, especial- ly in the developing world, will reduce soil loss and, with that, the loss of P. But the incentive to adopt these tech- niques will likely be the timely plant- ing, more intensive cropping, and improved rainfall-use efficiency report- ed in many countries.
The soil and P eroded from local hill- slopes or the uplands of drainage basins is not necessarily lost to agricul- tural production. For example, ~70 M ha rainfed rice is mostly terraced and bunded, retaining much of the sediment (and P) eroded either from nearby hillslopes or more distant uplands, helping to explain why the rainfed rice of subsistence farmers yields at all after decades with little or no P-fertilizer. Management of uplands to reduce soil erosion has implications for future P- fertilizer requirement of crops in areas of sediment deposition.
Losses from manure applied to non-arable land and landfill
Domestic animals produce 15 Mt P/year in manure, derived partly from crops (2.6 Mt P) but largely from graz- ing non-arable areas (12.1 Mt P). Of this, 8 Mt is applied to arable land and 7 Mt P is said to be ‘lost’, but some must be returned to non-arable land and replace P consumed by grazing animals. The real P ‘loss’ is hard to determine, although some will be transported in water runoff potentially incurring environmental costs.
Soil-P accumulation
This was not explicitly estimated by Cordell et al. (2009), but can be deduced from their data. P inputs to arable land totaled 22 Mt P/year, com- prising RP-based fertilizer (14 Mt P) and animal manure (8 Mt P). Plant removal from arable land was 10 Mt P (from the source data) and ‘loss’ in soil erosion was 8 Mt P/year. So there is a net apparent accumulation in soil of 4 Mt P, or greater if some of the P input that appears to replace P lost in ero- sion actually accumulates in surface soil. This accumulation is often said to reflect ‘inefficiency’, a point considered later. Average accumulation covers a range of situations from fields that are high in P and getting higher (e.g. sites of animal waste disposal) through to fields that are low in P and getting lower (e.g. many subsistence small- holders).
Crop losses – pests and diseases
Loss of 3 Mt P/year may be an illusion of P accounting, as yield loss to the farmer does not necessarily translate to P loss to the food producing system. Any P that is not truly lost from the system must be accounted for as addi- tional P accumulation in soil. The driv- er here is improved plant protection to raise productivity and profitability, even if less crop area needs to be sown and fertilized.
The vegetarian diet
Of the 3 Mt P consumed annually by humans, only 0.6 Mt is derived from domestic animals (Cordell et al. 2009), showing that whilst vegetarians con- sume less P than omnivores, the sav- ing in total P is small. Moreover, reducing animal product in the diet may inadvertently increase demand for P fertilizer.
The reason is that although 2.6 Mt P in harvested crops goes to domestic animals, the 8 Mt they return to arable land as manure represents a transfer of P from non- arable land to arable land, reducing the need for P-fertilizer on crops. Of course, this comes at the cost of P depletion in non-arable land.
Recycling from urban consumers to rural producers
Of the 3 Mt P/year produced in human excreta, 1.2 Mt P is ‘lost’ to landfill and application to non-arable land (some of which may be grazed or forested). Some 1.5 Mt P is lost in sewage discharge to surface water, often with adverse environmental impacts. Only the remaining 0.3 Mt P is recycled to arable land, and this could be usefully increased. Safe, effective nutrient recycling or recovery from sewage and other organic waste streams is a relatively mature research area, with recovery using struvite (MgNH4PO4) crystallization being especially promising (eg Ali et al. 2003). Market forces, if not regula- tion, will determine how quickly such nutrient recovery is implemented. Globally, though, any saving in RP from recycling human waste will be so small that reducing P discharge to sur- face water will remain the stronger driver for recycling.
Improving on-farm P-efficiency
From the analysis above, seemingly the biggest global opportunity to reduce fertilizer consumption is to manage soil erosion, which removes native soil P and the P accumulation from fertilizer and manure application. Presumably there are also opportuni- ties to manage ‘losses’ in animal waste, but the real magnitude of this loss is unclear. The on-farm opportu- nity most often referred to is the apparent inefficiency leading to P accumulating in soil. The following section teases out some of the thinking behind this inefficiency to indicate where it might be improved through agricultural management or breeding.
Fertilizer efficiency
To increase P-use efficiency in agricul- ture we first need to be clear about how to measure it. The following defi- nitions follow Syers et al. (2008).
Agronomic P efficiency: (Yield+P -Yield-P)/Papplied
Apparent recovery or efficiency: (P uptake+P - P uptake-P)/Papplied
These measures suit nutrients such as nitrogen that, if managed well, leave little residual; but P uptake from fertil- izer rarely exceeds 25% in the year of application although eventual recovery may be as high as 90% over appropri- ate timescales (Syers et al. 2008). So P-balance efficiency is also needed at the level of a field or whole-farm over a sequence of crops, or years.
P-balance efficiency: P/P
output input (applied)
Plant physiologists and breeders are more interested in:
Physiological efficiency:
(Yield+P -Yield-P)/(P uptake+P -P uptake-P)
The ideal farm would have fields with balanced P budgets and soil P near the critical concentration for the plants in the production system. In this state, P-balance efficiency over time would be high even though agro- nomic P efficiency would be low. Realistically though, a balanced farm P budget is much more attainable than a balanced budget and optimal soil P on all parts of all fields – that is the future of precision agriculture or at least more-precise agriculture, and it depends on having relevant measures of soil or plant P status and the knowl- edge and confidence to use them. Research on precision management of P nutrition is lagging behind nitrogen because both real-time soil P analysis at the time of fertilizer application and remote sensing of plant P status are more difficult.
The P status of agricultural soils
Some soils receive insufficient P inputs to replace outputs, so P status declines over time. This may be a deliberate strategy to exploit high fertility (giving high yields with high agronomic effi- ciency), or because farmers can’t afford enough fertilizer on soils of lower fertility. Or it may reflect an approach to organic farming that pre- cludes imports of P to a farm that is exporting P in product (Burkitt et al. 2007).
More generally, long-term use of fertilizer raises the organic and inor- ganic P status above their native states. Economic plant production requires P inputs to exceed P outputs until soil P approaches the agronomic threshold for production, because sol- uble P fertilizers are readily “fixed” in soil as adsorbed P, sparingly-soluble precipitates of P, and as organic P which is recalcitrant to mineralisation, collectively labelled ‘slowly-available P’ in Fig. 2.
When P application exceeds plant uptake it is often interpreted as fertiliz- er inefficiency, although it may really be low apparent recovery. In P-defi- cient soils it is better seen as the neces- sary accumulation of soil P to the point where inputs can more closely balance outputs at a high level of pro- ductivity. The fact that P-fertilizer use is falling in many developed countries is a sign that soil P levels are high enough for farmers to attempt to bal- ance P budgets or in some cases to run negative P budgets.
Available P in agricultural soils obvi- ously lies on a continuum from defi- ciency through to and above the criti- cal concentration for economic pro- duction. The strategy to improve P efficiency on any field or farm depends on its P status and related economic and environmental considerations, as well as the objectives of the farmer.
The options for reducing dependen- cy on RP-based fertilizer are shown in Fig. 2, where it is assumed that soil- conserving tillage practices have min- imised erosion losses.
Improving on-farm P-efficiency – soils with excess P
In soils with excess P inputs may be reduced to improve farm profitability and reduce environmental risk. A large body of research has led to inter- national acceptance that soils with plant-available P concentrations signifi- cantly above the agronomic threshold are at increased risk of ‘leaking’ P to the environment.
It remains unclear whether or not there is a threshold for environmental-P risk similar to the agronomic threshold, but it ought to be possible on most soils to temporarily halt or reduce P application without sacrificing productivity when soil P is above the agronomic threshold. Difficulties arise where farm/field soil P concentrations are heterogeneous and it is not feasible to either detect or manage the localised areas of greatest risk. Further difficulties arise where land managers are reluctant to reduce fertilizer use when this has been one of the foundations for raising productivity.
Soils used for intensive horticulture and dairy production commonly have strongly positive farm and/or field P balances, resulting in soil P concentra- tions that are well above the agronom- ic threshold as well as runoff water with greatly elevated P concentrations (Australian examples include Nash and Murdoch 1997; Hollinger et al. 2001). Excessive use of P is not necessarily confined to intensive industries.
In southern Australia where agriculture is regarded as ‘extensive’ compared to Western Europe, a recent survey found that over half the soils with fertilized crops and/or pastures had plant-avail- able P concentrations at or above criti- cal values, yet these farms generally had small positive farm P-balances (D Weaver and M Wong, pers. comm.). Farmers are continuing to apply P at rates greater than replacement, even though 'losses' to the slowly-available pool of soil P should be small. It is pertinent to ask why these farmers do this, but there is no easy answer.
Improving on-farm P-efficiency – soils near or below the agronomic threshold
In these soils, apart from managing soil erosion, there are four long-term options (or combinations of them) for using less RP-based fertilizer (Fig. 2).
1. Draw on ‘alternative’ P sources (e.g. sewage or reclaimed P)
2. Reduce RP-based inputs, maintain the same enterprise, draw down soil P, and accept lower production as P out- puts fall to balance inputs (become less intensive)
3. Reduce RP-based inputs, switch enterprise to one exporting less P (e.g. grain to fibre)
4. Maintain the same enterprise, reduce P concentration in the export- ed product whilst maintaining produc- tivity (e.g. breed low phytate-P grain, Bowen et al. 2006)
Regarding option 2, if P-fertilizer inputs are reduced and outputs exceed inputs, then available soil P must eventually fall even if ‘slowly- available’ P or other ‘available but less- accessible’ resources on the farm maintain the available P and produc- tivity for a time. This period may be prolonged if soil P reserves are high or intra-farm P transfers are large, although productivity (not necessarily profitability) must inevitably fall, even on organic farms (Burkitt et al. 2007; Cornish 2009). This period can also be extended by improving fertilizer efficiency.
In higher-P soils below the agronom- ic threshold, improved fertilizer effi- ciency would mean that slowly avail- able P could be drawn down further than is otherwise possible when P out- puts exceed P inputs (in option 2); but eventually inputs need to balance out- puts to maintain productivity. Increasing fertilizer efficiency alone cannot reduce the long-term demand for fertilizer. The reasons for seeking fertilizer efficiency are economic.
In lower-P soils, improved fertilizer efficiency reduces the amount of P ‘lost’ to the slowly available pool as fertility is built up, again providing an economic benefit whilst tying up less P unproductively in soil.
Substantial current research aims to improve fertilizer efficiency or appar- ent recovery by managing interactions between pools of P and retaining less P in the slowly-available pool (see Syers et al. 2008; Special Issue of Crop and Pasture Science (60), 2009). The strategies mostly focus on (i) improv- ing P uptake efficiency or (ii) modify- ing roots or using microbial inoculants to explore greater soil volumes or access less-available forms of P. None of them yet allows high production from low-P soils.
Of the tools available to scientists to maintain current enterprises with high production, only physiological P effi- ciency (option 4) will improve long- term farm P efficiency, allowing high productivity of existing enterprises with reduced P inputs to the farm.
Improving soil P testing
Reliable soil testing underpins most strategies for improved P manage- ment. It is easy to criticise farmers for not using soil tests more, but perhaps they justifiably lack confidence in soil testing (and associated advisory servic- es). In graphs of soil P v. crop or pas- ture yield there is usually large uncer- tainty around ‘critical’ values that leads to uncertainty in the interpretation of soil test values (cf. Figs. 2 and 3 in Gourley et al. 2009). There are many reasons for this variation. Australian experience may hold a clue for other low-rainfall or seasonally dry areas.
Here, dry surface soils have long been known to increase fertiliser require- ment (Cornish 2011), yet this is rarely considered when interpreting soil test values and making fertiliser recom- mendations, except to place fertiliser deeper into moist soil if surface drying is expected (e.g. Rose et al., 2009). New soil tests are being developed with improved predictive power over a range of soil types (Mason et al., 2010) although interpretation will still need to account for surface soil dry- ing.
Soil acidity, soil acidification and lime
The availability of P is reduced in soils with acid soil reaction (pH). Liming of excessively acid agricultural soil (< pH 5) has long been practiced, bringing sparingly soluble precipitates of P into soil solution (Fig. 2). Since the 1980’s the concern has not so much been with soil acidity per se as with soil acidification.
This occurs slowly and naturally in many soils, but the rate is accelerated by agriculture, a process described by Helyar and Porter (1989). Vast global areas of neutral to acid arable soils are becoming more acid. Amongst other effects, this increases fertilizer-P requirements. Whilst liming can correct soil acidity, it is more important to reduce the rates of acidi- fication in the first place. Some acidifi- cation is unavoidable, but rates are increased by certain nitrogenous fertil- izers.
Ammonium-based fertilizers are worst, including the widely used di- ammonium phosphate (DAP) and mono-ammonium phosphate (MAP). Urea is less acidifying, and potassium nitrate and superphosphate fertilizers do not acidify soil. Another major cause of acidification is nitrate leach- ing from soils, which can be addressed through fertilizer and crop manage- ment.
Conclusions
There will not be a supply-con- strained peak in RP mine production in coming decades. Any shortage of RP is more likely to be related to geopolitical and trade issues. Peak P is not an appropriate tool for pre- dicting the life of RP reserves because it takes no account of demand, which is expected to plateau mid-century and then decline as population stabilizes and soil P concentrations rise in develop- ing countries.
Although the global P budget sug- gests there is significant inefficiency on farms, much of this apparent inefficiency is associated with soil erosion. This can be managed through soil-conserving cultural practices which will be adopted increasingly for a range of benefits other than reduced loss of P. There
are also strong economic and envi- ronmental reasons to reduce P inputs where soil P is already high. There are few other on-farm options for reducing long-term demand for RP. Inputs must replace outputs once soil P concentrations are high enough for economic production. A range of agronomic and plant breeding approaches to improve agronomic efficiency will improve farm profitability and may reduce the amount of P tied up in slowly available forms in soil, but they will not reduce the long-term demand for RP.
Soil P testing is central to many of the strategies for using P more effi- ciently (and profitably), but farmers in rainfed Australia (at least) seem to lack confidence in the tests. Research that leads to wider, effec- tive use of soil tests is recommend- ed.
References
- Ali, M.I., Schneider, P.A. and Hudson, N. (2003) Assessing nutrient recovery from piggery efflu- ents. MODSIM03 NZ.
- Bowen, D.E., Guttieri, M.J., Peterson, K., Raboy, V. and Souza, E.J. (2006) Phosphorus fractions in developing seeds of four low-phytate barley (H. vulgare L.) genotypes. Crop Science 46, 2468- 2473.
- Burkitt, L.L., Small, D.R., McDonald, J.W., Wales, W.J. and Jenkin, M.L (2007) Comparing irrigated biodynamic and conventionally man- aged dairy farms. 1. Soil and pasture properties. Australian Journal of Experimental Agriculture 47, 479–488.
- Cordell, D., Drangert, Jan-Olof and White, S. (2009) The story of phosphorus: Global food security and food for thought. Global Environmental Change, 19, 292–305.
- Cordell D., White, S. and Lindstrom, T. (2011) Peak phosphorus: the crunch time for humanity? The Sustainability Review, April 4, 2011.
- Cornish, P.S. (2009) Phosphorus management of organic and low-input farms. Crop and Pasture Science, 60, 105-115.
- Cornish, P.S. (2010) A postscript to Peak P – an agronomist’s response to diminishing P reserves. Proc. Of the New Zealand Grasslands Association 72: XXVII-XXXIV.
- Cornish, P.S. (2011) Donald Oration: On farm- ing systems and the importance of partnerships between farmers and researchers. Agricultural Science 23, 26-35.
- Déry, P. and Anderson, B. (2007) Peak phos- phorus. Energy Bulletin. August, 2007 energybul- letin.net/node/33164.
- Freebairn, DM, Cornish, PS, Anderson, WK, Walker, SR, Robinson, JB and Beswick, AR (2006) Management Systems in Climate Regions of the World – Australia. In ‘Dryland Agriculture’ 2nd ed. Agronomy Monograph 23. (American Society of Agronomy, Crop Science Society of America, Soil Science Society of America: Madison, Wisconsin USA.) Chapter 20: 837-878.
- Grimm, K.A., (1998) There's no substitute for phosphate: Looming fertilizer ore problems threaten our food security. Monitor 7(4), 18-21. I Gourley, C.J.P., Melland, A., Waller, R., Awty, I., Smith, A.P., Peverill, K. and Hannah, M. (2009) Making better fertiliser decisions for grazed pas- tures in Australia. Bulletin DPI, Victoria.
- Helyar K.R. and Porter W.M. (1989). ‘Soil acidification, its measurement and the processes involved’. In A.D. Robson (ed.), Soil Acidity and Plant Growth, Academic Press, Sydney, NSW.
- Hollinger, E., Cornish, P.S., Baginska, B., Mann, R. and Kuczera, G. ( 2001) Farm-scale stormwa- ter losses of sediment and nutrients from a mar- ket garden near Sydney. Agricultural Water Management, 47, 227-241.
- Hubbert, M.K. (1949) Energy from fossil fuels. Science, 109, 103.
- Jasinski S.M. (2009) U.S. Geological Survey, Mineral Commodity Summaries, January 2009, p 121.
- Jasinski, S.M. (2011) U.S. Geological Survey, Mineral Commodity Summaries, January 2011, p 119.
- Kauwenbergh, S. (2010) World Phosphate Rock Reserves & Resources. IFDC, Sept. 2010.
- Lazenby, A. (1976) Fertilizer resources and the sub and super philosophy. (In) Reviews in Rural Science 3, Ed. G Blair (UNE), Aug. 1976.
- Mason, S., McNeill, A. and McLaughlin, M.J. (2010) Expanding the use of Diffusive Gradients in Thin-Films (DGT) for assessing phosphorus requirements of different crop types. "Food Security from Sustainable Agriculture" Ed. H. Dove and R. A. Culvenor Proc. 15th Agronomy Conference, 15-18 November 2010, Lincoln, New Zealand.
- Rose, T.J., Rengel, Z., Ma, Q. and Bowden, J.W. (2009) Phosphorus accumulation by field-grown canola crops and the potential for deep phospho- rus placement in a Mediterranean-type climate. Crop and Pasture Science 60, 987–994.
- Steen, Ingrid (1998) Phosphorus availability in the 21st century: Management of a non-renew- able resource. Phosphorus and Potassium, 217, 25-31.
- Syers, J.K., Johnston, A.E. and Curtin, D. (2008) Efficiency of soil and fertilizer phosphorus use. FAO Fertilizer and Plant Nutrition Bulletin 18, Rome, 2008.
- Nash, D. and Murdoch, C. (1997) Phosphorus ni runoff from a fertile dairy pasture. Australian Journal of Soil Research 35, 419-29.
- Rustomji, P., Caitcheon, G. and Hairsine, P. (2008) Combining a spatial budget with geo- chemical tracers and river station data to con- struct a catchment sediment budget. Water Resources Research, 44: 10.1029/2007WR006112.
- Van Vuuren, D.P., Bouwen, A.F. and Beusen, A.H.W. (2010) Phosphorus demand for the 1970-2100 period: A scenario analysis of resource depletion. Global Environmental Change 20, 428-439.
- Vitousek, P.M., Naylor, R., Crews, T., David, M.B., Drinkwater, L.E., Holland, E., Johnes, P.J., Katzenberger, J., Martinelli, L. A., Matson, P. A., Nziguheba, G.. Ojima, D., Palm, C.A., Robertson, G.P., Sanchez, P.A., Townsend, A. R. and Zhang, F.S. (2009) Nutrient imbalances in agricultural development. Science 324, 1519-1520.
- Von Horn, J. and Sartorius, C. (2009) International conference on nutrient recovery from wastewater streams. Eds Ashley, K., Mavinic, D. and Koch, F. ISBN: 9781843392323 (IWA Publishing, London).
Figures
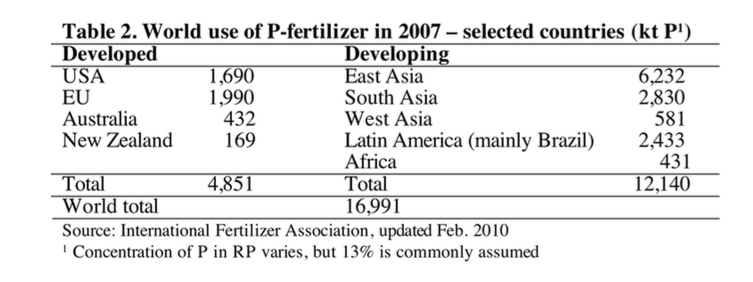
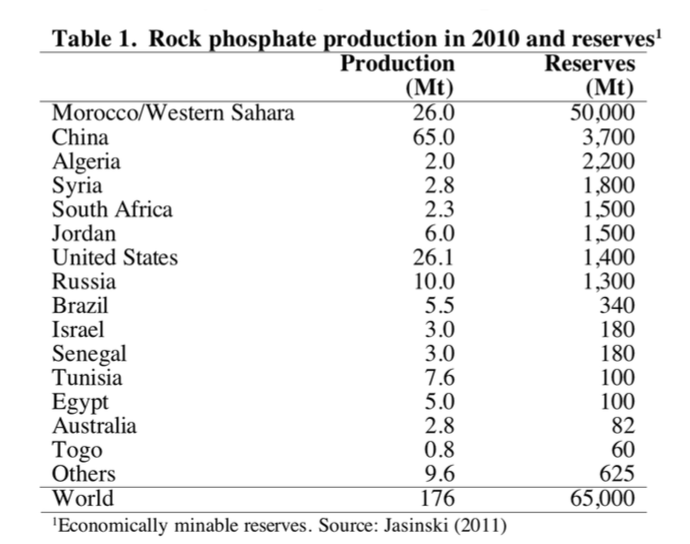
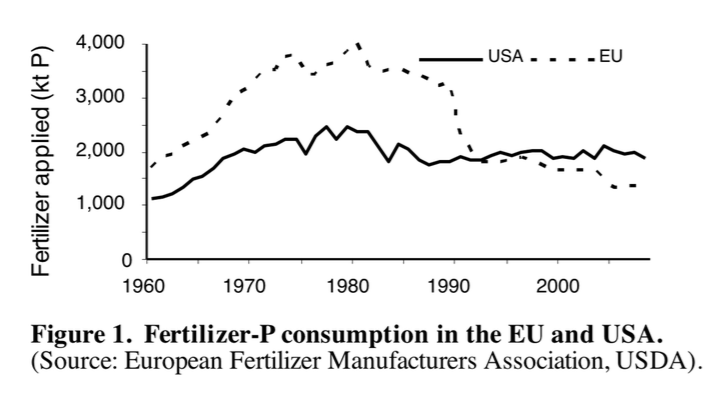
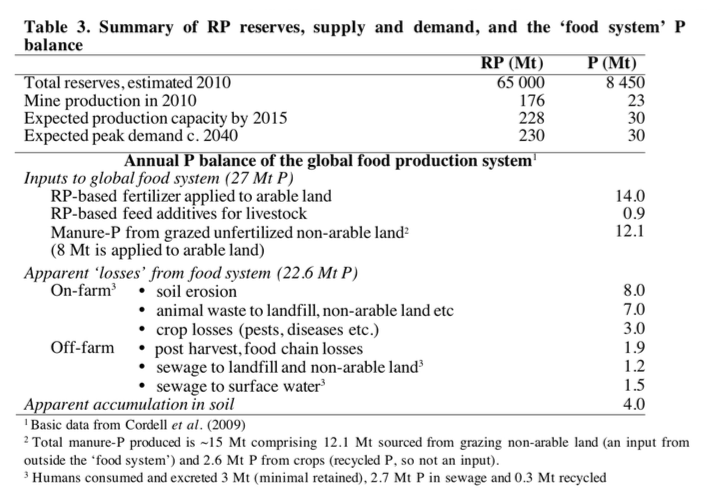
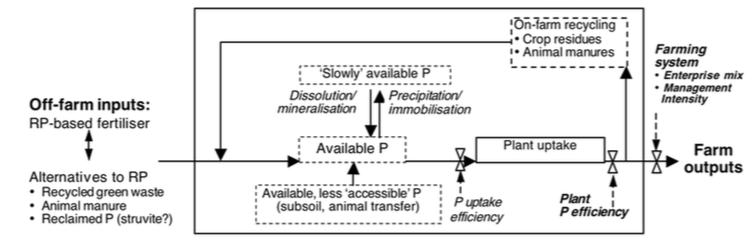
Fig 2: Conceptual framework to consider options for reducing dependen- cy on RP-based fertilizer at farm scale. Boxes with broken lines denote P stocks, solid lines denote flows. Bold italic text denotes where farm-level P efficiency can be improved. Uptake efficiency includes genetic and agronomic methods. The framework excludes environmental losses by assuming that surface erosion is minimized with soil-conserving tillage. Soil P can also be managed to reduce environmental losses (see text).
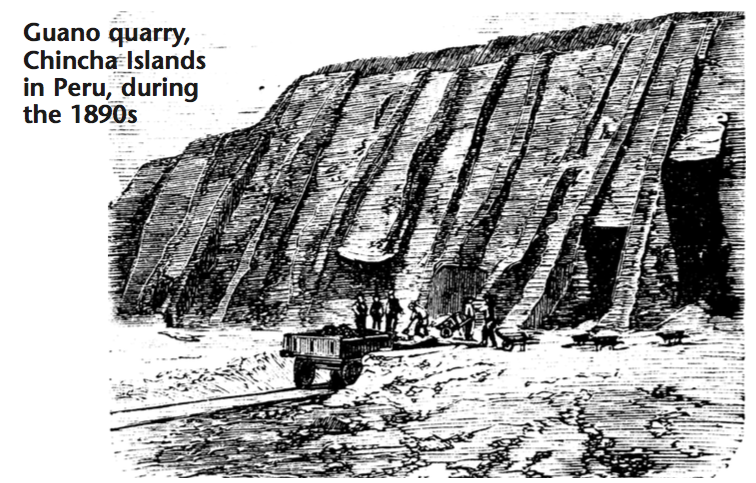
Guano quarry, Chincha Islands in Peru, during the 1890s