
The global, environmental and economic impact of biotech crops 1996-2010
Summary
This is a review of published (mostly) peer-reviewed scientific and economic evidence relating to some of the important economic and environmental impacts of biotech crops, following their commercial introduction in 1996. It examines the economic impacts on yields, key costs of production, direct farm income and the production base of the four main crops of soybeans, maize, cotton and canola. The analysis shows that there have been substantial net economic benefits at the farm level, amounting to $14 billion in 2010 and $78.4 billion for the fifteen year period. Biotech crops have also made important contributions to increasing global production of the four main crops; adding, for example, 97.5 million tonnes and 159 million tonnes to global production of soybeans and maize respectively. It also examines the impact of changes in pesticide use and greenhouse gas emissions arising from the use of biotech crops. The technology has reduced pesticide spraying by 443 million kg (9.1%) and, as a result, decreased the environmental impact associated with herbicide and insecticide use on these crops (as measured by the indicator the Environmental Impact Quotient (EIQ) by 17.9 %. The technology has also significantly reduced the greenhouse gas emissions from this cropping area, which, in 2010, was equivalent to removing 8.6 million cars from the roads.
Keywords: Herbicide tolerance, glyphosate, insect resistance, maize, soybeans, cotton, canola, pesticides, greenhouse gas emissions
Abbreviations
GM genetically modified; HT herbicide tolerance; IR insect resistance; Bt Bacillus thuringiensis; NT no tillage cultivation; RT reduced tillage cultivation; Mt million tonnes; G billion, 1000 M, or 109; GHG greenhouse gases.
Literature Citations
This paper presents an assessment of the global economic and environmental impact of GM crops since their commercial introduction in 1996. It is based on two papers by the authors in the peer reviewed journal GM Crops1. This article is a synopsis of those specific papers, so we have adopted a slightly different referencing system to that normally adopted.
Introduction
since their commercial introduction in 1996. It is based on two papers by the authors in the peer reviewed journal GM Crops1. This article is a synopsis of those specific papers, so we have adopted a slightly different referencing system to that normally adopted.
Although the first commercial genetically modified (GM) crops were planted in 1994 (tomatoes), 1996 was the first year in which a significant area of crops containing GM traits was planted (1.66 million hectares). Since then there has been a significant increase in plantings and by 2010/11, the global planted area reached over 139 million hectares.
GM traits have largely been adopted in four main crops; canola, maize, cotton and soybeans, although small areas of GM sugar beet (adopted in the USA and Canada since 2008), papaya (in the USA since 1999 and China since 2008) and squash (in the USA since 2004) have also been planted. GM traits accounted for 42% of the global plantings to soybeans, maize, cotton and canola in 2010.
The main traits so far commercialised have essentially been derived from bacteria and convey:
- Tolerance to specific herbicides (notably glyphosate and glufosinate) in maize, cotton, canola (spring oilseed rape) and soybeans2. The technology allows for the ‘over the top’ spraying of crops with the trait, of these specific broad-spectrum herbicides, that target both grass and broad-leaved weeds;
- Resistance to specific insect pests of maize and cotton. This ‘Bt’ technology offers farmers resistance in the plants to major pests such as corn borers and rootworm (e.g. Ostrinia nubilalis, Diabrotica spp.) in maize and bollworm/budworm (Heliothis spp.) in cotton. The analysis provides an assessment of some of the key economic and environmental impacts associated with the global adoption of biotech crops. The aim is to contribute to greater understanding of the impact of this technology and facilitate more informed decision making, especially in countries where crop biotechnology is currently not permitted.
The environmental impact analysis focuses on:
- Changes in the amount of insecticides and herbicides applied to the biotech crops relative to conventionally grown alternatives and;
- The contribution of biotech crops towards reducing global GHG emissions.
It is widely accepted that increases in atmospheric levels of greenhouse gases such as carbon dioxide, methane and nitrous oxide are detrimental to the global environment3. Therefore, if the adoption of crop biotechnology contributes to a reduction in the level of greenhouse gas emissions from agriculture, this represents a positive development for the world.
The economic analysis concentrates on farm income because this is a primary driver of adoption amongst farmers and also quantifies the (net) production impact of the technology. The authors recognise that an economic assessment could exam- ine a broader range of potential impacts (e.g. on labour usage, households, local communities and economies).
However, these are not included because undertaking such an exercise would add considerably to the length of the paper and an economic assessment of wider economic impacts would probably merit a separate assessment in its own right.
Methodology
The results are based on extensive analysis of existing farm level impact data for GM crops. Whilst primary data for impacts of commercial cultivation were not available for every crop, in every year and for each country, a substantial body of representative data are available and these have been used as the basis for the analysis. Further details of the methodology, data sources and references4 can be found in the two GM Crops journal papers referred to above.
Readers of this paper are therefore encouraged to read the original papers (available from the journal on open access). The considerable body of literature examining the impact of the technology, available in peer reviewed literature forms the cornerstone of this analysis.
Results and discussion
Environmental impacts of insecticide and herbicide use Since 1996, the use of pesticides on the biotech crop area has been reduced by 443 million kg of active ingredient (9.1% reduction), and the environmental impact associated with herbicide and insecticide use on these crops, as measured by the EIQ indicator5, has reduced by17.9% (Table 1).
In absolute terms, the largest environmental gain has been associated with the adoption of GM insect resistant (IR) cotton (a 23.9% reduction in the volume of active ingredient used and a 26% reduction in the EIQ indicator 1996-2010). This reflects the significant reduction in insecticide use that the technology facilitated in what has traditionally been an intensive user of insecticides.
The quantity of herbicide active ingredient used in biotech soybean crops also decreased by 34 million kg (1996-2010), a 1.7% reduction, whilst the overall environmental impact associated with herbicide use on biotech soybeans decreased by a significantly larger 16.4%. This highlights the switch in herbicides used with most GM herbicide tolerant (HT) crops to active ingredients with a more environmentally benign profile than those generally used on conventional crops.
In maize, herbicide and insecticide use decreased by 212.8 million kg (1996-2010) and the associated environmental impact of pesticide use decreased, due to a combination of reduced insecticide use (37.7%) and a switch to more environmentally benign herbicides (11.5%). In canola, biotech farmers reduced herbicide active ingredient use by14.4 million kg (18.2%) and the associated environmental impact of herbicide use on this crop area fell by 27.6%, again owing to use of more environmentally benign herbicides.
The environmental benefits associated with reduced insecticide and herbicide use (Table 2) shows a reduction between 1996 and 2010, respectively in developed and developing countries of 55% and 45%. Over three-quarters (76%) of the environmental gains in developing countries have been from the use of GM IR cotton.
In some regions where GM HT crops have been widely grown, some farmers (eg, in the USA and Argentina) have relied too much on the use of single herbicides, like glyphosate, for weed control and this has contributed to the development of resistant weed populations.
The development of weeds resistant to herbicides, or of gene flow from crops to wild relatives, is not new in agriculture and is, therefore, not an issue unique to the adoption of crop biotechnology. All weeds have the ability to adapt to selection pressure, and there are examples of weeds that have developed resistance to a number of herbicides and also to mechanical methods of weed control (e.g. prostrate weeds such as dandelion which can survive mowing).
Weed resistance occurs mostly when the same herbicide(s), with the same mode of action, has been applied on a continuous basis over a number of years.
There are hundreds of resistant weed species confirmed in the International Survey of Herbicide Resistant Weeds (www.weedscience.org). Worldwide, there are 24 weed species that are6 resistant to glyphosate, compared to 107 weed species resistant to ALS herbicides and 69 weed species resistant to triazine herbicides, such as atrazine.
Several of the confirmed glyphosate resistant weed species have also been found in areas where no GM HT crops have been grown. For example, there are currently 13 weeds recognised in the US as exhibiting resistance to glyphosate, of which two are not associated with glyphosate tolerant crops.
A few of the glyphosate resistant species, such as marestail (Conyza canadensis) and palmer pigweed (Amaranthus palmeri) are now widespread in the USA. In Argentina, development of resistance to glyphosate in weeds such as Johnson grass (Sorghum halepense) is also reported.
Where this has occurred, farmers have had to adopt reactive weed management strategies incorporating a mix of herbicides. While the overall level of weed resistance in areas planted to GM HT crops is still relatively low, growers of GM HT crops are increasingly being advised to be more proactive and include other herbicides in combination with glyphosate in their weed management programmes, even where weed resistance to glyphosate has not been found, in order to reduce the risk of resistance developing.
This is because proactive weed management programmes generally require fewer herbicides and are more economical than reactive programmes. The adoption of both reactive and proactive weed management programmes in GM HT crops has already begun to influence the mix, total amount and overall environmental profile of herbicides applied to GM HT soybeans, cotton, maize and canola and this is reflected in the data presented in this paper.
For example, in the USA GM HT soybean crop in 2010, just over a third of the area received an additional treatment of one of the following active ingredients7, 2 4 D, chlorimuron, clethodim and flumioxazin, compared with 13% of the crop which received one of these four herbicides in 2006. As a result, the average amount of herbicide active ingredient applied to GM HT soybeans in the US (per hectare) has increased by about a third over the last five years (the associated EIQ value has increased by about 27%).
Nevertheless, this compares with the average amount of herbicide active ingredient applied to conventional (non GM) soybean, which increased by 15% over the same period (the associated EIQ value for conventional soybeans increased by 27%). The increase in the use of herbicides on conventional soybeans in the US can also be partly attributed to the development of weed resistance to herbicides commonly used and highlights that the development of weed resistance to herbicides is a problem faced by all farmers, regardless of production method. Currently, the environmental profile of GM HT crops (as measured by the EIQ indicator) continues to represent an improvement compared to the conventional alternative.
Impact on GHG emissions
The scope for biotech crops contributing to lower levels of GHG emissions comes from two principle sources8:
a) Reduced fuel use from less frequent herbicide or insecticide applications and a reduction in the energy used in soil cultivation. The fuel savings associated with making fewer spray runs (relative to conventional crops) and the switch to conservation, reduced and no-till farming systems reduced carbon dioxide emissions by 1,715 million kg, arising from reduced fuel use of 642.2 million litres in 2010 (Table 3). The largest reductions in carbon dioxide emissions have come from GM HT soybeans (about 85% of total savings), particularly in South America.
Over the period 1996 to 2010, the cumulative permanent reduction in fuel use of 4,582 million litres has been equivalent to 12,232 million kg of carbon dioxide..
b) The use of ‘no-till’ and ‘reduced-till’ farming systems. These production systems have increased significantly with the adoption of GM HT crops. The technology has improved growers’ ability to control competing weeds, reducing the need to rely on soil cultivation and seed-bed preparation as means of weed control. As a result, in addition to reduced fuel use for tillage, soil quality is enhanced and soil erosion reduced. In turn more carbon remains in the soil and this leads to lower GHG emissions.
Based on savings arising from the rapid adoption of no till/reduced tillage farming systems in North and South America, an extra 4,805 million kg of soil carbon is estimated to have been sequestered in 2010 alone (equivalent to 17,634 million tonnes of carbon dioxide that has not been released into the global atmosphere: Table 3).
Since 1996, the equivalent of 133,639 million tonnes of carbon dioxide has not been released into the global atmosphere9. The reader should note that this increase in soil carbon is based on savings arising from the rapid adoption of NT/RT farming systems in North and South America (Argentina and Southern Brazil), for which the availability of GM HT technology, has been cited by many farmers as an important facilitator.
GM HT technology has, therefore, probably been an important contributor to increased soil carbon sequestration, no doubt aided by the availability of relatively cheap generic glyphosate (the real price of glyphosate fell threefold between 1995 and 2000 once patent protection for the product expired). Cumulatively, the amount of carbon sequestered may be higher than these estimates due to year-on-year benefits to soil quality (e.g. increased organic matter, reduced soil erosion, greater water retention and reduced levels of nutrient run off).
However, it is equally likely that the total cumulative soil sequestration gains have been lower because only a proportion of the crop area will have remained in NT/RT. It is not possible to estimate confidently cumulative soil sequestration gains that take into account reversions to conventional tillage because of a lack of data.
Consequently, the estimate of 133,639 million tonnes of carbon dioxide not released into the atmosphere should be treated with caution as it is not possible to confidently estimate the probable soil carbon sequestration gains since 1996.
These carbon dioxide emission reductions for 2010 are equivalent:
- To removing 0.76 million cars from the road.
- The additional probable soil carbon sequestration gains are equivalent to removing 7.84 million cars from the roads.
Impact on farm income
GM technology has had a significant positive impact on farm income derived from a combination of
enhanced productivity and efficiency gains (Table 4).
In 2010, the direct global farm income benefit from biotech crops was $14 billion. This is equivalent to adding 4.3% to the value of global production of the soybean, maize, canola and cotton crops. Since 1996, GM technology has increased farm incomes by $78.4 billion.
The largest gains in farm income in 2010 are from cotton, largely from yield gains, with $5 billion of additional income generated by GM insect resistant (GM IR) cotton in 2010. This is equivalent to adding 14% to the value of the crop in the biotech growing countries, or adding the equivalent of 11.9% to the $42 billion value of the global cotton crop in 2010.
Substantial gains have also arisen in maize through a combination of higher yields and lower costs. In 2010, maize farm income in the biotech adopting countries increased by almost $5 billion and since 1996, the sector has benefited from an additional $21.6 billion. The 2010 income gains are equivalent to adding 6% to the value of the maize crop in these countries, or 3.5% to the $139 billion value of total global maize production.
This is a substantial increase in value added terms for two new maize seed technologies. Significant increases in farm incomes have also resulted in the soybean and canola crops. GM HT technology in soybeans increased farm incomes by $3.3 billion in 2010, and since 1996 has delivered over $28 billion of extra farm income (the highest cumulative increase in farm income of the biotech traits). For canola, (largely in North American) an additional $2.7 billion has been generated between 1996 and 2010.
At the country level (Table 5), US farmers have been the largest beneficiaries of higher incomes, realising over $35 billion in extra income between 1996 and 2010. This is not surprising given that US farmers were the first to make widespread use of GM crop technology and for several years the GM adoption levels in all four US crops have been in excess of 80%.
Important farm income benefits ($17.7 billion) have occurred in South America (Argentina, Bolivia, Brazil, Paraguay and Uruguay), mostly from GM technology in soybeans and maize. GM IR cotton has also been responsible for an additional $20 billion additional income for cotton farmers in China and India.
In 2010, 54.8% of the farm income benefits were earned by farmers in developing countries. The vast majority of these gains have been from GM IR cotton and GM HT soybeans. Over the fifteen years, 1996-2010, the cumulative farm income gain derived by developing country farmers was $39.24 billion, equal to 50% of the total farm income during this period.
The cost to farmers for accessing GM technology, across the four main biotech crops, in 2010, was equal to 28% of the total value of technology gains (defined as the farm income gains referred to above plus the cost of the technology payable to the seed supply chain10).
In developing countries the total cost was equal to 17% of total technology gains compared with 37% in developed countries.
Whilst circumstances vary between countries, the higher share of total technology gains accounted for by farm income in developing countries relative to developed countries reflects factors such as weaker provision and enforcement of intellectual property rights in developing countries and the higher average level of farm income gain per hectare derived by farmers in developing countries compared to those in developed countries.
Crop production effects
Based on the yield impacts used in the direct farm income benefit calculations above and taking account of the second soybean crop facilitation in South America (see below), biotech crops have added important volumes to global production of corn, cotton, canola and soybeans since 1996 (Table 6).
The biotech IR traits, used in corn and cotton, have accounted for 98% of the additional corn production and 99.4% of the additional cotton production. Positive yield impacts from the use of this technology have occurred in all user countries (except for GM IR cotton in Australia11) when compared to average yields derived from crops using conventional technology (such as application of insecticides and seed treatments).
The average yield impact across the total area planted to these traits over the 15 years since 1996 has been +9.6% for maize and +14.4% for cotton (Figure 1). Although the primary impact of biotech HT technology has been to provide more cost effective (less expensive) and easier weed control, as opposed to improving yields, the improved weed control has, nevertheless, delivered higher yields in some (especially developing12) countries (e.g. HT soybeans in Romania, Bolivia and Mexico, HT corn in Argentina and the Philippines).
Biotech HT soybeans have also facilitated the adoption of no tillage production systems, shortening the production cycle. This enables many farmers in South America to plant a crop of soybeans immediately after a wheat crop in the same growing season. This second crop, additional to traditional soybean production, has added 96.1 Mt to soybean production in Argentina and Paraguay between 1996 and 2010 (accounting for 98.5% of the total biotech-related additional soybean production).
Concluding comments
During the last 15 years, the adoption of crop biotechnology (by 15.4 million farmers in 2011) has delivered important economic and environmental benefits by facilitating more environmentally friendly farming practices.
More specifically:
- biotech IR traits have mostly delivered higher incomes through improved yields, and environmental gains, mostly from decreased use of insecticides;
- The gains from biotech HT traits have come from a combination of effects. The farm income gains have mostly arisen from reduced costs of production. Environmental improvements are associated with the increased use of more environmentally benign herbicides and the facilitation of changes in farming systems. Thus, biotech HT technology (especially in soybeans) has played an important role in enabling farmers to capitalise on the availability of a low cost, broad- spectrum herbicide (glyphosate) and in turn, facilitated the move away from conventional to low/no-tillage production systems in both North and South America. This change in production system has delivered reduced levels of GHG emissions (from reduced tractor fuel use and additional soil carbon sequestration).
Over reliance on the use of glyphosate by some farmers, in some regions, has contributed to the development of weed resistance.
As a result, farmers are increasingly adopting a mix of reactive and proactive weed management strategies incorporating a mix of herbicides.
Nevertheless, the overall environmental gains arising from the use of biotech crops have been, and continue to be, substantial.
Even though there is a considerable body of evidence, in peer reviewed literature, and summarised in this paper, that quantifies these positive economic and environmental impacts of crop biotechnology, many remain opposed to the technology.
These groups, who are ideologically opposed to GM technology and often have vested interests in other forms of agricultural production, continue to denigrate GM technology. Almost all of the papers cited by these groups to ‘support’ their claims tend not to be published in peer review journals. Some are inaccurate or misleading and make inappropriate use of official data.
The ‘inconvenient truth’ that those opposed to GM crop technology fail to address is that the rate of adoption and use of crop biotechnology in global agriculture since the mid-1990s has been rapid and widespread.
The analysis in this paper provides insights into the reasons why so many farmers around the world have adopted and continue to use the technology. Readers are encouraged to read the peer reviewed papers cited, and the many others who have published on this subject (and listed in the references of Brookes and Barfoot) and to draw their own conclusions.
References
- 1.GM Crops and Food 3:2, p 1-9 April-June 2012 (environmental impact paper) and Vol. 4, Oct/Dec 2012 forthcoming for economic impact paper. Available at www.landesbio-science.com/journal/gmcrops
- 2.Also sugar beet in North America
- 3.See for example Intergovernmental Panel on Climate Change (2006)
- 4.The total number of reference sources used totals about 150, most of which are from peer reviewed journals
- 5.The environmental impact quotient (EIQ), developed by Kovach et al (1992), effectively integrates the various environmental impacts of individual pesticides into a single ‘field value per hectare’. The EIQ value is multiplied by the amount of pesticide active ingredient (ai) used per hectare to produce a field EIQ value. For example, the EIQ rating for glyphosate is 15.33. By using this rating multiplied by the amount of glyphosate used per hectare (e.g., a hypothetical example of 1.1 kg applied per ha), the field EIQ value for glyphosate would be equivalent to 16.86/ha. The EIQ indicator provides an improved assessment of the impact of GE crops on the environment when compared to only examining changes in vol- ume of active ingredient applied, because it draws on some of the key toxicity and environ- mental exposure data related to individual products, as applicable to impacts on farm workers, consumers and ecology.
- 6. www.weedscience.org - accessed July 2012
- 7.The four most used herbicide active ingre- dients used on soybeans after glyphosate (source: derived from GfK Kynetec)
- 8.The methodology used to assess impact on greenhouse gas emissions combines reviews of literature relating to changes in fuel and tillage systems and carbon emissions cou- pled with evidence from the development of relevant biotech crops and their impact on both fuel use and tillage systems. Reductions in the level of GHG emissions associated with the adoption of biotech crops are acknowl- edged in a wide body of literature including American Soybean Association Conservation Tillage Study. 2001, Fabrizzi K et al. 2003, Jasa P 2002, Reicosky D 1995, Robertson G et al. 2000, Johnson et al. 2005, Leibig et al. 2005 and West T. Post W. 2002
- 9.These estimates are based on fairly conser- vative assumptions. Also, some of the addi- tional soil carbon sequestration gains from RT/NT systems may be lost if subsequent ploughing of the land occurs. Estimating the possible losses that may arise from subsequent ploughing would be complex and difficult to undertake. This factor should be taken into account when using the estimates presented in this paper
- 10.The cost of the technology accrues to the seed supply chain including sellers of seed to farmers, seed multipliers, plant breeders, dis- tributors and the GM technology providers.
- 11.This reflects the levels of Heliothis spp (boll and bud worm pests) pest control previ- ously obtained with intensive insecticide use. The main benefit and reason for adoption of this technology in Australia has arisen from sig- nificant cost savings (on insecticides) and the associated environmental gains from reduced insecticide use. I 12.But not exclusively.
References cited in footnotes in this paper
- American Soybean Association Conservation Tillage Study (2001) http://soygrowers.com/ctstudy/ctstudy_files/fra me.htm.
- Brookes, G & Barfoot, P (2012) Global Impact of Biotech Crops: Environmental Effects, 1996-2010. GM Crops and Food 3: 2 April- June 2012, p 1-9. Available on-line at http://www.landesbioscience.com/journal/gmc rops.
- Brookes, G & Barfoot, P (2012) The income and production effects of biotech crops globally 1996-2010. GM Crops and Food 4: Oct-Dec 2012 (in press). Available on-line at http://www.landesbioscience.com/journal/gmc rops
- Fabrizz,i K., Moron, A. & Garan, F. (2003) Soil Carbon and Nitrogen Organic Fractions in Degraded VS Non-Degraded Mollisols in Argentina. Soil Science Society of America Journal. 67:1831-1841.
- GfK Kynetec (2012) USA Pesticide usage farm panel dataset (annually updated). www.gfk.com
- Intergovernmental Panel on Climate Change (2006) Chapter 2: Generic Methodologies Applicable to Multiple Land- Use Categories. Guidelines for National Greenhouse Gas Inventories Volume 4. Agriculture, Forestry and Other Land Use. (http://www.ipcc- nggip.iges.or.jp/public/2006gl/pdf/4_Volume4 /V4_02_Ch2_Generic.pdf).
- Jasa P. (2002) Conservation Tillage Systems, Extension Engineer, University of Nebraska.
- Reicosky D. (1995) Conservation tillage and carbon cycling: soil as a source or sink for carbon. University of Davis, USA.
- Johnson et al. (2005) Greenhouse gas con- tributions and mitigation potential of agricul- ture in the central USA. Soil Tillage Research. 83. 73-94.
- Kovach, J. C. et al (1992). A method to measure the environmental impact of pesti- cides. New York's Food and Life Sciences Bulletin. NYS Agricul. Exp. Sta. Cornell University, Geneva, NY, 139. 8 pp. Annually updated http://www.nysipm.cornell.edu/publi- cations/EIQ.html
- Leibig et al. (2005) Greenhouse gas contri- butions and mitigation potential of agriculture practices in north-western USA and Western Canada. Soil Tillage Research. 83. 25-52.
- West T. & Post W. (2002) Soil Organic Carbon Sequestration Rates by Tillage and Crop Rotation: A Global Analysis. Soil Science Society of American Journal. 66 November/December: 930-1046.
- Robertson, G., P, E & Harwood R. (2000) Greenhouse Gases in Intensive Agriculture: Contributions of Individual Gases to the Radioactive Forces of the Atmosphere. Science. 289, No. 5486, 1922-1925.
Figures
Table 1 Effect of changes in the use of herbicides and insecticides in global biotech crops, 1996-2010 (ai, active ingredient; EIQ, environ- mental impact quotient – see Kovach et al., 1992
Table 2 Effect of lower insecticide and herbicide use 1996-2010 in biotech crops for developing compared with developed countries. (EIQ, environmental impact quotient – see Kovach et al., 1992
Table 3. Effect of biotech crops on fuel usage, carbon dioxide emis- sions and carbon sequestration in 2010.
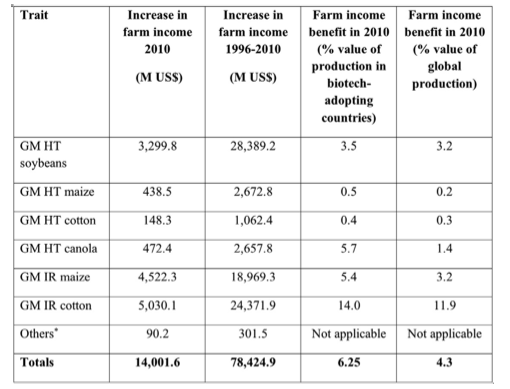
Table 4. Global farm income benefits from growing biotech crops 1996-2010.
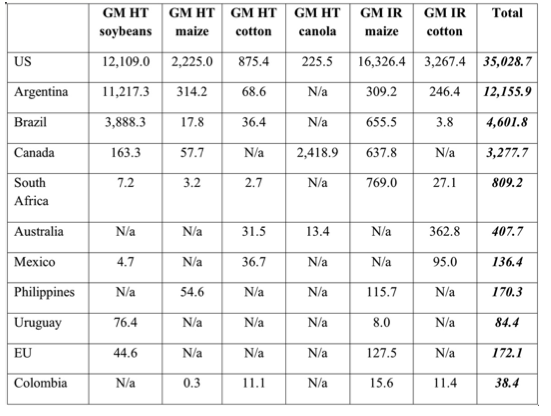
Table 5. Overall benefits of GM crop farm income 1996-2010 for selected countries (M US $).
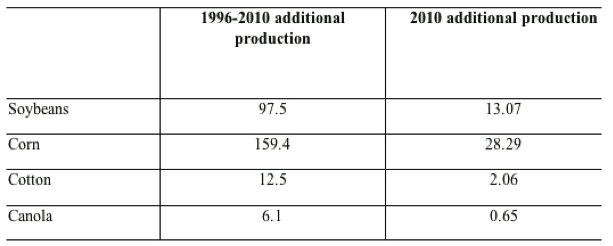
Table 6. Additional crop production arising from positive yield effects of biotech crops (Mt).
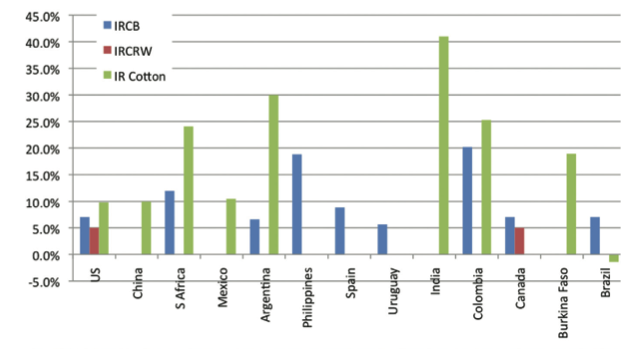
Figure 1. Average increase in yield (%) of biotech IR traits 1996-2010 by country and trait (IRCB, resistant to corn boring pests; IRCRW, resistant to corn rootworm; IR, insect resistant cotton.